SWIFTFarm monitoring platform2026-05-28T06:32:26+00:00

SWIFTFarm
Platform

What starts as a small patch of stress today can become tomorrow’s lost yield.

SWIFTFarm
Platform

What starts as a small patch of stress today can become tomorrow’s lost yield.
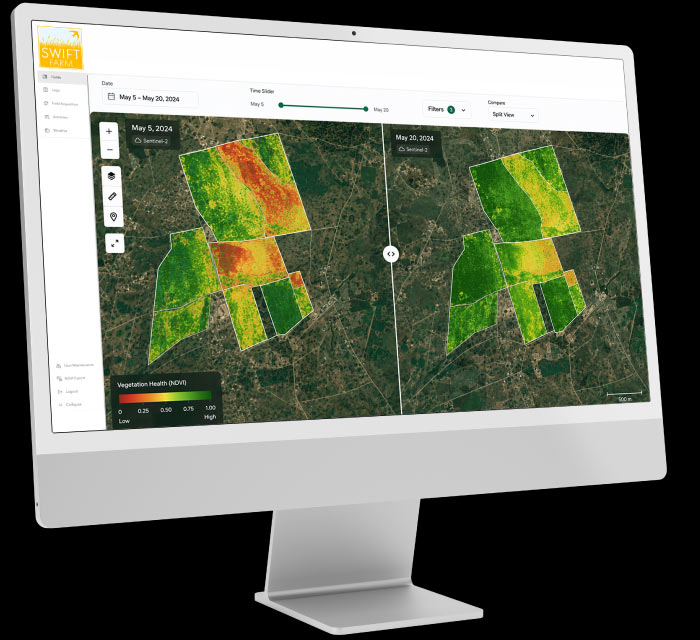
SWIFTFarm is an online monitoring platform that uses satellite imagery to give you clear, timely insights into farm health, in-field stress, and harvesting activity.

Through a custom-built dashboard, all visual and analytical data is brought together in one place, so you can track what’s happening across your fields and make informed decisions with confidence.

We’re proud to work with

ABF Sugar
UPL-Logo-White
Omnia-Logo-White

Extensive experience with agricultural clients

Our extensive experience with farming clients has allowed us to develop accurate and valuable analytic insights to support field health and optimize crop yield.

We monitor over

200 000
Hectares

Of agricultural land worldwide

The system makes use of Planet daily 3m and 8-band imagery to run its analytics. This imagery can be collected depending on the end-user’s need and budget.

Options available:

  • Weekly
  • Biweekly
  • Monthly
  • Daily on demand

All the information gathered through the imagery is stored and used to highlight potential trends and risk compartments.

Who is SWIFTFarm built for?

SWIFTFarm is designed to help farmers make informed decisions, allocate ground teams more efficiently,
& prevent crop loss through flagging early signals of stress, pests, disease, & illegal activity.
Who-Should-Use-Farm-Owners

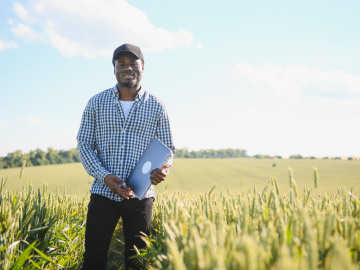
Farm Owners

Farm owners benefit from SWIFTFarm by having a holistic overview of their farms and crop health allowing them to plan effectively and support their decision making.
Who-Should-Use-Field-Workers

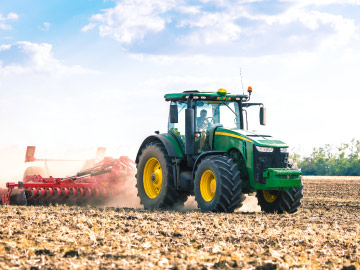
Field Workers

Field workers use SWIFTFarm to maintain field health, monitor harvest tracking, and optimize crop yield.

Farming Organisations

SWIFTFarm supports government owned farms or farming organizations by managing encroachment, providing trend insights and ensuring supported farms are maintained and thrive.

NGOs / NPOs

NGOs/ NPOs benefit from the remote nature of SWIFTFarm’s platform allowing them to monitoring large and small-scale farms all over the world.

Platform functionality

After years of experience in the farming industry, we saw the same challenges repeated across teams of all sizes: limited visibility, rising risks, costly field visits, and slow, paper-based reporting.

We started this platform to close that gap — to give farm managers a simple, reliable way to monitor their assets, catch problems early, and make smarter decisions with less effort.

01

Register on SWIFTFarm & Upload areas of interest (AOIs)

02

Determine desired monitoring frequency

03

System will collect Planet 3m, 8-band or Sentinal-2 10m, 12 band, imagery over AOIs

04

The system will run in-field stress and operational analyses on selected AOIs, helping identify environmental pressure, infrastructure impacts, vegetation disturbance, water-related risks, and other indicators that may affect mining performance and compliance.

05

Dashboard will auto-update with the latest imagery and analytics

06

Platform is secure and ready-to-use

SWIFTFarm
Platform

Core Capabilites

SWIFTFarm is designed to help farmers make informed decisions, allocate ground teams more efficiently, & prevent crop loss through flagging early signals of stress, pests, disease, & illegal activity.

It achieves these goals through its primary capabilities; Field Health, In-Field Stress, Harvesting Detection.

NDVI vegetation index

Using the NDVI vegetation index, we determine the estimate health of a field, this assists in maintaining healthy compartments & visualising individual field and farm trends over time.

In-field Stress

A powerful tool to identify potential risks to areas; in-field stress can discover fields of concern before their risk spreads into other zones. Used to detect die-off within fields before they spread to entire fields.

Harvesting Detection

Empowers farmers by tracking and logging harvesting events, building up a detailed log of total hectares harvested, harvest dates, and potentially flagging illegal harvesting events.

In addition to our SWIFTFarm
Monitoring solution, we also offer
a range of add-on services.

Add-ons include:

• In-field Surveys
• Above Ground Biomass
• Biodiversity Assessments
• Automated Fire Monitoring
• Field Digitisation/ Delineation
• High Resolution Base Mapping
• Post-Fire & Burn Scar Analyses
User Experience

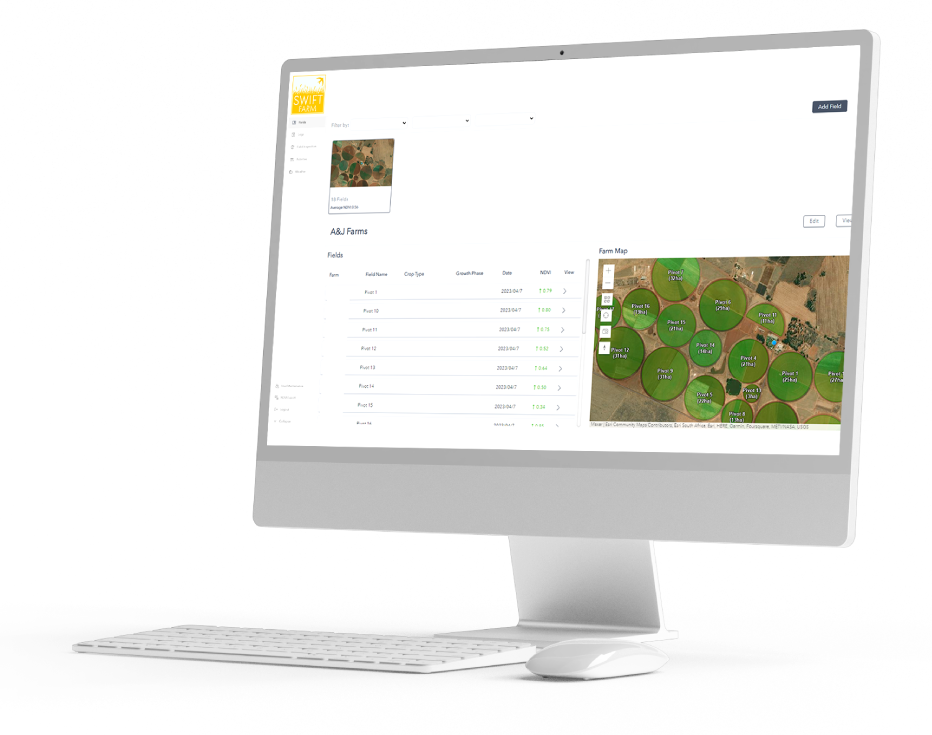
We have designed the SWIFTFarm platform to be intuitive, accessible, and easy to use, ensuring that farmers, agronomists, and agricultural stakeholders can seamlessly access the insights, monitoring tools, and spatial intelligence the platform provides.

Our SWIFTFarm platform is live, interactive, and built to support smarter agricultural decision-making.

Our systems are REST
API compatible and can
be linked or integrated
into existing systems if
necessary.

Simple login

Intuitive colours

Legends & Labelling

Fast load times

Platform display

Homepage – Map Overview

The homepage of the platform, the Map page, this is the best page for viewing the satellite imagery. The Map page has additional features such as time sliders, filters, and dual map modes which are useful for visualising and comparing areas.

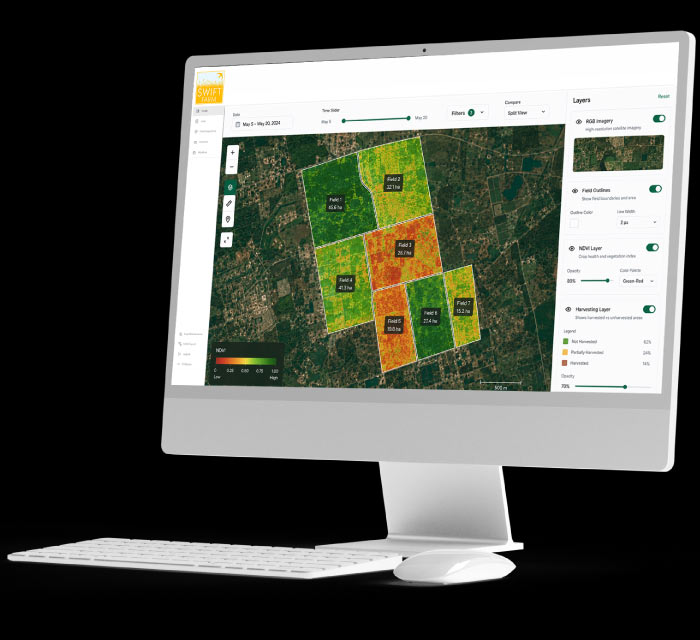
Homepage – Field Mapping

Layers can be toggled on or off, including:

  • RGB Imagery
  • Field outlines
  • NDVI layers
  • Harvesting layers

These separate layers help to visuals all the fields and their unique health and harvesting information.
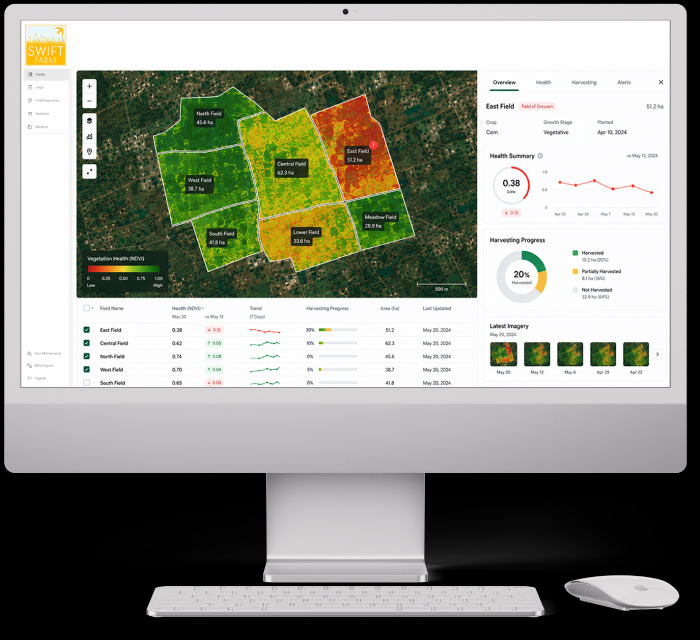
Monitoring Page

The Monitoring page is designed to combine imagery and analytic data. Individual, grouped, or all fields can be selected to view the latest health & harvesting data.
Fields of concern and latest harvesting is best viewed through this page.

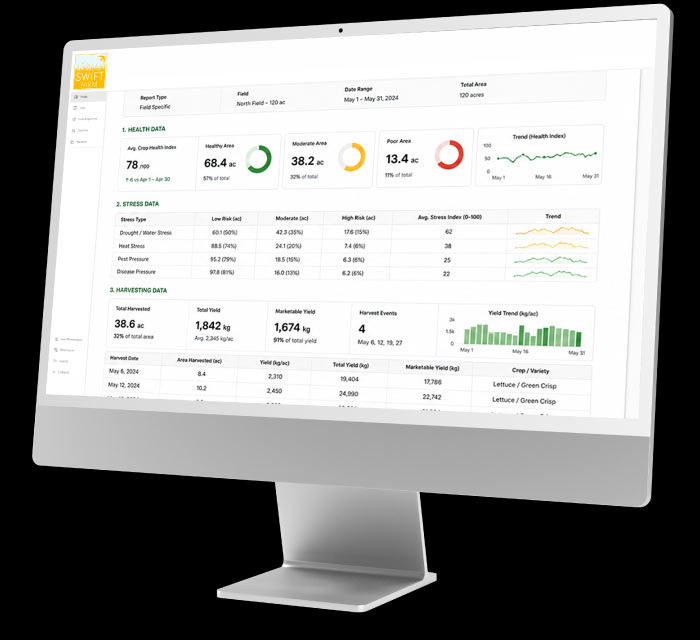
Report Page

Print out a report using the report tool, which gives a detailed display of all health, stress & harvesting data available.

This can be a field specific or a general report depending on the user’s selection at time of printing. The report layout is customisable.
Pricing

Our costing is compromised of the following

Platform
cost

Storage
and Hosting Fee’s

Setup Fee
*New client only

Support hours
*support hours are optional but recommended

Our solutions are tailored-made & no two mines are the same. As such, pricing is not fixed & quotations are free-of-charge & remain valid for 30 days.

Platform costs are charged at a fixed rate per hectare. We offer bulk discounts for areas larger than 100,000 hectares; further discounts may be applicable for extensive sites.

Frequently Asked Questions

Is GIS suitable for small-scale farms?2026-03-27T09:19:12+00:00

Yes, GIS is suitable for small-scale farms and can be adapted to fit operations of any size. While often associated with large commercial agriculture, GIS can provide real value even on smaller farms by improving visibility and decision making.

For small-scale farmers, GIS helps monitor crop health, identify problem areas, and manage inputs more efficiently without requiring large teams or complex infrastructure. It allows farmers to focus their efforts where it matters most, rather than treating the entire farm uniformly.

Because GIS solutions are scalable, they can start with basic monitoring and gradually expand as needs grow. This means farmers can adopt the technology at their own pace, adding more data, analysis, or features over time.

Ultimately, GIS supports better use of resources, reduces unnecessary costs, and helps small-scale farms operate with the same level of insight typically associated with larger operations.

Can GIS help predict crop yields?2026-03-27T09:21:58+00:00

Yes, GIS can support crop yield prediction when combined with additional data inputs. SWIFTFarm uses spatial analysis alongside historical data, weather patterns, and current crop conditions to estimate potential yields across fields.

Satellite imagery provides insight into crop health and growth patterns over time, while historical datasets help establish baseline performance for specific fields. When this is combined with weather data such as rainfall and temperature trends, it becomes possible to model how crops are likely to perform under current conditions.

That said, accurate yield prediction requires more than remote sensing alone. Ground data remains essential. Collaboration between farmers, field teams, and GIS specialists is needed to collect and validate yield information, ensuring that models are calibrated correctly and reflect real-world conditions.

The result is not a fixed prediction, but a data-informed estimate that improves over time as more information is collected. This supports better planning, resource allocation, and decision making throughout the growing season.

What is precision agriculture?2026-03-26T11:59:18+00:00

Precision agriculture is a farming approach that uses GIS technology, satellite imagery, and data analysis to manage fields at a more detailed level rather than treating the entire farm as a single unit. Instead of applying inputs uniformly, it focuses on understanding variation within fields and responding accordingly.

Using spatial data, farmers can identify differences in soil conditions, moisture levels, crop health, and growth patterns across their land. This allows water, fertiliser, and pesticides to be applied only where they are needed, rather than across entire fields. The result is more efficient resource use, reduced input costs, and improved crop performance.

Precision agriculture also supports better timing of operations. By monitoring field conditions regularly, farmers can decide when to irrigate, fertilise, or harvest based on actual conditions rather than fixed schedules.

Over time, this data-driven approach builds a clearer understanding of how each field behaves, helping improve planning, reduce waste, and increase overall productivity. It shifts farming from broad estimation to targeted, informed decision making.

What type of satellite imagery is used for SWIFTFarm?2026-03-26T11:58:02+00:00

SWIFTFarm primarily uses Planet’s 3 metre, 8-band PlanetScope satellite imagery as the foundation for agricultural monitoring. This imagery is collected frequently, allowing farms to be observed consistently across planting, growing, and harvesting cycles.

The 8-band spectral capability supports detailed vegetation analysis by capturing information beyond standard visual imagery. This enables accurate field health assessment, helping identify areas of strong crop performance as well as zones experiencing stress due to water shortages, pests, or soil variability.

PlanetScope imagery also supports harvesting detection by tracking changes in field conditions over time. By comparing imagery across different dates, SWIFTFarm can identify when and where harvesting activity has occurred, providing a clear record of field operations.

For projects that require more detailed analysis, an additional high-resolution satellite image can be incorporated. This is typically used for base mapping, boundary verification, and more focused investigations where finer spatial detail is needed.

How does the Automated Fire Monitoring system work?2026-03-26T11:57:04+00:00

The Automated Fire Monitoring system within SWIFTFarm is designed to detect fire events early and track their impact across agricultural land. It starts with continuous monitoring using NASA’s thermal infrared sensors, which identify abnormal heat signatures that may indicate active fires or emerging hotspots.

When a potential fire event is detected, the system automatically sends an alert notification. This allows farmers and land managers to respond quickly, which is critical for protecting crops, infrastructure, and surrounding land.

After detection, SWIFTFarm schedules the collection of high-resolution 3 metre, 8-band Planet satellite imagery for the following seven days. This imagery is used to monitor how the fire spreads, how quickly it moves, and which areas are affected over time.

Once the event has stabilised, the imagery is analysed to produce post-fire damage assessments and burn scar analyses. These outputs help quantify the affected area, support recovery planning, and provide useful data for reporting or insurance claims.

The system provides a complete workflow from early detection to post-event assessment, helping agricultural operations respond faster and recover more effectively.

What are some add-on services available for SWIFTFarm?2026-03-26T11:53:17+00:00

SWIFTFarm offers a range of add-on services that extend the platform beyond standard monitoring, allowing farmers and agricultural managers to gain deeper insight and more detailed analysis where needed.

Automated fire monitoring can be included to detect and track fire activity across farmland, providing early warning and helping reduce risk to crops and infrastructure. Post-fire damage and burn scar analysis can then be used to assess affected areas, support recovery planning, and provide clear records for reporting or insurance purposes.

Crop biomass analysis is available as an advanced layer of insight, helping estimate crop growth and productivity across fields. This supports yield estimation, performance tracking, and more informed decision making throughout the growing season.

Field digitisation services allow farm boundaries, blocks, or management zones to be accurately mapped and structured within the platform. In-field surveys can be integrated to capture ground-level observations and validate remote sensing data, improving overall data reliability.

For more detailed investigations, high-resolution satellite imagery can be added to provide greater clarity at a field level. This is particularly useful for identifying specific issues, validating conditions, or supporting precision agriculture practices.

Together, these add-on services allow SWIFTFarm to be tailored to specific agricultural needs, whether the focus is productivity, risk management, or detailed field-level analysis.

What is included in the standard SWIFTFarm product?2026-03-26T11:52:13+00:00

The standard SWIFTFarm product provides access to the SWIFTFarm platform through an online dashboard designed for agricultural monitoring and analysis. This dashboard acts as a central space where satellite imagery, field data, and analytics are brought together for easy interpretation and use.

Included in the product is recurring satellite imagery collected at regular intervals. This allows farmers and agricultural managers to monitor changes over time, track seasonal patterns, and maintain consistent visibility across all fields.

The platform also delivers field health insights, highlighting areas of strong growth as well as zones that may require attention. In-field stress detection identifies potential issues such as water stress, pest pressure, or soil variability, enabling more targeted interventions and better resource management.

Harvesting detection data is included to track activity across fields, providing a clear record of when and where harvesting occurs. This supports operational planning, reporting, and overall farm management.

Together, these features provide a practical, data-driven view of agricultural operations, helping improve efficiency, reduce input waste, and support better decision making.

What is GIS and how is it used in agriculture?2026-03-26T11:49:49+00:00

GIS, or Geographic Information Systems, is used in agriculture to collect, analyse, and visualise spatial data related to farming operations. It allows farmers and agricultural managers to understand what is happening across their land, not just in isolated fields, but as a connected system.

In practical terms, GIS is used to monitor crop health, assess field conditions, and track changes over time using satellite imagery and spatial data. It helps identify areas under stress, whether from water shortages, pests, or soil variability, allowing for more targeted interventions rather than broad, uniform treatments.

GIS also supports resource management by helping optimise the use of inputs such as water, fertiliser, and pesticides. By understanding spatial variation within fields, farmers can apply resources more efficiently, reducing waste and improving yields.

Beyond day-to-day operations, GIS plays a role in planning and reporting. It can be used to map farm boundaries, analyse seasonal trends, track planting and harvesting activity, and support compliance with agricultural regulations or sustainability requirements.

Overall, GIS turns farm data into actionable insight, helping improve productivity, reduce costs, and support more informed agricultural decision making.

Go to Top