SWIFTMine2026-05-28T13:42:21+00:00

SWIFTMine
Platform

You can’t manage mining risk if you can’t see what’s changing.

SWIFTMine
Platform

You can’t manage mining risk if you can’t see what’s changing.

SWIFTMine-Logo-White

SWIFTMine is an online monitoring platform that uses satellite imagery to track surface change, infrastructure, dwelling expansion, and potential encroachment, including TSF movement, all delivered through a single, easy-to-use dashboard.

We’re proud to work with

Royal-Bafokeng-Nation-White-Logo-2

The Future of Mine Monitoring

The sector of mineral exploration and extraction is inherently spatial and can make great use of GIS to reduce risk and reduce costs associated with
providing relevant parties with information to facilitate timely decision making.

24 Hour Access

to your custom designed online platform for graphical result display and decision support

The system makes use of Planet and Vantor daily 3m and 8-band imagery to run its analytics. This imagery can be collected depending on the end-user’s need and budget.

Options available:

  • Weekly
  • Biweekly
  • Monthly
  • Ad-hoc

All information gathered through the imagery is stored on the platform and used to highlight potential trends and risk areas.

Who is SWIFTMine built for?

By combining satellite imagery with automated change detection, SWIFTMine helps teams reduce reliance on costly field visits, improve compliance, and respond to risks earlier, making it easier to manage complex sites with clarity and confidence.

Whether it’s monitoring encroachment on government-owned land, tracking TSF movement and site changes at active mines, assessing vegetation recovery at closed sites, or establishing high-resolution baselines for new projects, the platform delivers consistent, actionable insight through one central dashboard.

Government

SWIFTMine supports government owned areas by managing encroachment, providing trend insights and ensuring compliance with environmental laws.

Active Mines

Active mines benefit from SWIFTMine through its ongoing monitoring system which tracks TSF, encroachment and other site changes all at once.
Closed Mines

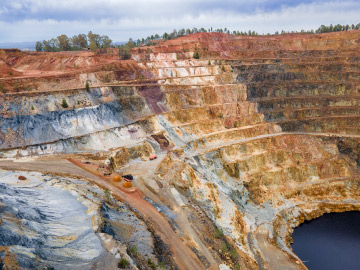
Closed mine sites can use SWIFTMine to monitor restoration initiatives providing insights into changes in vegetation health and off-set initiatives.

Prospective Mines

SWIFTMine supports prospective mines by managing encroachment on the site, providing high resolution baseline mapping and ensuring compliance with mining and prospecting laws.

Platform functionality

After years of experience in the mining industry, we saw the same challenges repeated across teams of all sizes: limited visibility, rising risks, costly field visits, and slow, paper-based reporting.

We started this platform to close that gap — to give mine managers a simple, reliable way to monitor their assets, catch problems early, and make smarter decisions with less effort.

01

Register on SWIFTMine & Upload areas of interest (AOIs)

02

Determine desired monitoring frequency

03

System will collect Planet 3m 8-band and high resolution imagery over AOIs

04

System will run analysis on AOI’s for

  • Dwelling count
  • Change detection
  • TSF Surface Water
  • Subsistence monitoring
  • Encroachment monitoring

05

Dashboard will auto-update with the latest imagery and analytics

06

Platform is secure and ready-to-use

SWIFTMine
Platform

Core Capabilites

SWIFTMine enables mining stakeholders to make informed decisions, optimise resource deployment, and minimise risk by detecting early indicators of encroachment, tailings dam movement, and illegal activity.

Through advanced change detection, TSF monitoring, and fire detection, the platform provides timely insight that supports proactive, confident decision-making.

Change detection

Change detection and encroachment monitoring use satellite imagery to identify unauthorised land use, infrastructure expansion, and environmental disturbances around mining operations, providing near-real time alerts for rapid response and compliance management.

Tailings Dam Monitoring

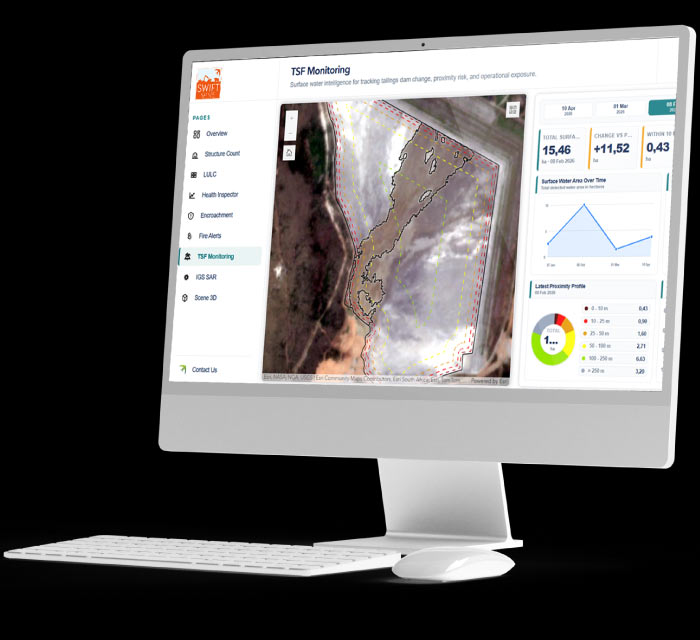
TSF Dam site monitoring is performed through surface area calculations which flags potential risk developments on or around the TSF dam site through the ongoing remote monitoring.

Dwelling Counts

SWIFTMine enables the monitoring of human movement and settlement activity across and around mining operations to support health, safety, and security management. Using high-resolution satellite imagery and geospatial intelligence, the platform helps identify informal dwelling growth, track population movement near active sites, and support relocation planning for new mining developments.

By providing accurate spatial insight into surrounding communities and site activity, SWIFTMine assists mining operators in improving risk management, regulatory compliance, stakeholder engagement, and sustainable mine planning.

In addition to our SWIFTForest
Monitoring solution, we also offer
a range of add-on services.

Add-ons include:

  • Dwelling Count
  • In-field Surveys
  • Mine Site Digitisation
  • Biodiversity Assessments
  • Land Cover Classifications
  • TSF Surface Area Calculations
  • High Resolution Base Mapping
  • Post-Fire & Burn Scar Analyses
  • Distance from Dam Wall Calculations

User Experience

We have designed the SWIFTMine platform to be intuitive, accessible, and easy to use, ensuring that mining stakeholders can seamlessly access the spatial intelligence, operational insights, and monitoring capabilities the platform provides.

Our SWIFTMine platform is live, interactive, and built for real-time decision-making.

Our systems are REST
API compatible and can
be linked or integrated
into existing systems if
necessary.

Simple login

Intuitive colours

Legends & Labelling

Fast load times

Platform display

Homepage – Mine Overview

The homepage of the platform, the Map page, this is the best page for viewing the satellite imagery.

The Map page has additional features such as time sliders, filters, and dual map modes which are useful for visualising and comparing areas.

Monitoring Page

Layers can be toggled on or off, including:

•RGB Imagery
•Mine Site & TSF outlines
•Change detection layers
These separate layers help to visuals all the areas
and their unique current and historical information.
Monitoring Page

The Monitoring page is designed to combine imagery and analytic data. Individual, grouped, or all sites can be selected to view the latest analytic data.

Areas of concern and latest changes are best viewed through this page.

Report Page

Generate detailed mining intelligence reports using the reporting tool, providing a comprehensive overview of operational activity, environmental monitoring, change detection, encroachment activity, rehabilitation progress, and infrastructure development across mining areas.

Reports can be generated for a specific pit, licence boundary, operational zone, or as a broader mine-wide overview depending on the user’s selection. The report layout and displayed datasets are fully customisable to suit operational, compliance, and stakeholder reporting requirements.

Pricing

Our costing is compromised of the following

Platform
cost

Storage
and Hosting Fee’s

Setup Fee
*New client only

Support hours
*support hours are optional but recommended

Our solutions are tailored-made & no two mines are the same. As such, pricing is not fixed & quotations are free-of-charge & remain valid for 30 days.

Frequently Asked Questions

Do dwelling counts give an exact population density?2026-03-25T11:45:53+00:00

No, dwelling counts do not provide an exact measure of population density. They serve as a proxy by estimating the number of structures within a given area, which can indicate levels of settlement or occupancy but not the actual number of people.

The relationship between dwellings and population can vary widely depending on factors such as household size, occupancy rates, and local living conditions. Because of this, dwelling counts should be used as an indicative metric rather than a precise population figure.

SWIFT Platforms do not include official census data by default. However, publicly available datasets can be integrated as an additional layer where needed. By combining dwelling counts with demographic or census data, a more complete and accurate understanding of population distribution can be achieved.

This approach allows users to balance high-frequency spatial monitoring with broader demographic context when required.

Can satellite imagery see what is under the surface?2026-03-25T11:44:41+00:00

No, standard satellite imagery cannot see below the surface. Multi-band satellite data captures information reflected from the earth’s surface, which means it is limited to observing visible features, vegetation, and surface conditions.

However, surface imagery can still provide indirect insight into subsurface conditions in some cases. For example, patterns such as vegetation stress, ground disturbance, or moisture variation may indicate underlying changes, but these are interpretations rather than direct measurements.

For accurate subsurface analysis, other data sources are required. SWIFTMine can integrate subsurface datasets such as geophysical surveys, borehole data, or LiDAR-derived models into the platform. This allows surface observations from satellite imagery to be combined with underground data, creating a more complete view of the site.

By linking surface and subsurface information, users can better understand how above-ground activity relates to underlying conditions, supporting more informed planning and analysis.

Can GIS monitor illegal encroachment or unauthorised activity?2026-03-25T11:43:39+00:00

Yes, GIS is highly effective for monitoring illegal encroachment and unauthorised activity. Using recurring satellite imagery and spatial analysis, SWIFT Platforms can detect changes in land use and activity outside approved boundaries.

By comparing imagery over time, the system identifies new structures, land clearing, informal settlements, or any activity that deviates from expected patterns. This is particularly valuable in mining and infrastructure environments where servitude zones and operational boundaries must be strictly maintained.

GIS enables continuous oversight across large or remote areas without relying solely on field inspections. When a change is detected, it can be flagged for further investigation, allowing teams to respond quickly and take appropriate action.

Over time, this creates a traceable record of encroachment or unauthorised activity, supporting compliance, reporting, and risk management processes.

Can GIS integrate with other mining systems?2026-03-25T11:42:17+00:00

Yes, GIS within SWIFTMine can integrate with a range of existing mining systems to provide a more connected and centralised view of operations. This includes integration with mine planning software, ERP systems, sensors, and reporting tools.

By linking GIS with mine planning systems, spatial data such as pit boundaries, haul roads, and operational zones can be aligned with production plans. This ensures that planning and on-the-ground activity remain consistent and visible in one environment.

Integration with ERP systems allows operational data, such as production figures or asset information, to be connected to specific locations. This adds spatial context to business data, making it easier to analyse performance across the site.

Sensor integration introduces real-time or near-real-time data into the platform, including environmental monitoring, equipment tracking, or safety indicators. This enhances situational awareness and supports faster response to changing conditions.

By bringing these systems together, SWIFTMine reduces data silos and creates a unified platform where spatial and operational data work together. The result is improved visibility, better coordination, and more informed decision making across the mining operation.

Can GIS track operational changes over time?2026-03-25T11:41:24+00:00

Yes, GIS is well suited for tracking operational changes over time through the use of time-series imagery and spatial analysis. By comparing data captured at different intervals, it creates a clear, visual record of how a site evolves.

In mining environments, this allows teams to monitor mine expansion, track the progression of excavation areas, and observe changes in infrastructure such as roads, stockpiles, and processing facilities. It also supports the monitoring of land rehabilitation efforts, helping verify whether disturbed areas are being restored according to plan.

Time-based analysis provides more than just snapshots. It reveals patterns and trends, making it easier to understand how operations develop, where activity is increasing, and whether changes align with operational plans or compliance requirements.

This historical view also supports reporting and audits, providing traceable evidence of site activity over time. By maintaining a continuous spatial record, GIS helps organisations move beyond isolated observations and gain a more complete understanding of operational performance.

Does GIS help with risk management in mining?2026-03-25T11:39:35+00:00

Yes, GIS plays a critical role in risk management within mining operations by providing a clear, spatial understanding of potential hazards and operational exposure. It allows mining companies to move from reactive responses to more structured, proactive risk management.

GIS is used to identify high-risk zones across a mine site, including unstable slopes, flood-prone areas, tailings storage facilities, and zones affected by environmental stress. By mapping these risks spatially, teams can prioritise monitoring and implement preventative measures more effectively.

Ongoing monitoring is another key advantage. GIS enables regular tracking of environmental conditions, land disturbance, infrastructure changes, and surrounding activity. This helps detect early warning signs of potential issues such as erosion, encroachment, or structural stress.

GIS also supports safety planning and emergency response. By integrating spatial data with operational plans, teams can design evacuation routes, allocate resources, and respond more efficiently during incidents. During an event, GIS provides a live or near-live view of conditions, improving coordination and decision making.

Over time, GIS builds a historical record of risk patterns and site behaviour, supporting better planning, compliance, and long-term operational resilience.

Can GIS monitor tailings storage facilities (TSFs)?2026-03-25T11:38:03+00:00

Yes, GIS is an effective tool for monitoring tailings storage facilities (TSFs), providing consistent visibility into surface conditions and potential risk indicators over time. Using satellite imagery and spatial analysis, TSFs can be monitored without relying solely on on-site inspections.

One of the primary methods used is surface area monitoring, which tracks changes in the extent of the tailings over time. This helps identify expansion, irregular deposition patterns, or unexpected changes that may require further investigation.

In addition to surface tracking, GIS can calculate the distance between tailings material and critical infrastructure such as dam walls. Monitoring these distances is important for identifying potential risk zones and ensuring that operational thresholds are not exceeded.

By combining these spatial measurements with regular monitoring cycles, GIS provides an ongoing record of TSF behaviour. This supports risk management, compliance reporting, and early identification of conditions that may require intervention.

What type of satellite imagery is used for SWIFTMine?2026-03-25T11:36:51+00:00

SWIFTMine primarily uses Planet’s 3 metre, 8-band PlanetScope satellite imagery as the foundation for mine monitoring and analysis. This imagery is captured frequently, allowing mining operations to be observed consistently over time.

The 8-band spectral capability supports detailed surface analysis, including land disturbance tracking, material differentiation, vegetation monitoring around mine sites, and environmental impact assessment. These additional spectral bands provide insight beyond standard visual imagery, making it easier to identify subtle changes across the site.

PlanetScope imagery is also well suited for change detection. By comparing images from different dates, SWIFTMine can track mining progress, infrastructure expansion, tailings storage facility changes, and other operational developments with a high level of consistency.

For projects that require greater detail, an additional high-resolution satellite image can be incorporated. This is typically used for base mapping, infrastructure verification, and more detailed secondary analyses where finer spatial resolution is needed.

How often can mines be monitored?2026-03-25T11:35:53+00:00

Monitoring frequency within SWIFTMine is flexible and can be tailored to match each operation’s requirements, risk profile, and budget. Rather than following a fixed schedule, monitoring cycles are selected based on how often site conditions are expected to change and how quickly insights are needed.

For high-activity or high-risk sites, near-daily monitoring can be used to track rapid changes such as active mining progress, environmental impact, or safety-related events. This level of frequency provides timely visibility and supports quicker decision making.

Weekly and bi-weekly monitoring is commonly used for operational oversight, allowing teams to track site development, infrastructure changes, and compliance indicators without generating unnecessary data volume. These intervals offer a practical balance between detail and cost.

Monthly assessments are often used for reporting, long-term trend analysis, and environmental monitoring. These cycles help track changes over time, support regulatory requirements, and provide a consistent record of site activity.

Ultimately, monitoring frequency is determined by what needs to be observed, how critical timely updates are, and how the data will be used across the operation.

How does the Automated Fire Monitoring system work?2026-03-25T11:34:42+00:00

The Automated Fire Monitoring system within SWIFT Platforms is designed to detect fire events early and track their progression using a combination of thermal sensing and satellite imagery. It begins with continuous monitoring through NASA’s thermal infrared sensors, which identify abnormal heat signatures across large areas. These thermal anomalies often indicate active fires or emerging hotspots before they are visible through standard imagery.

Once a potential fire event is detected, the system automatically triggers an alert notification, allowing teams to respond quickly and assess the situation. This early warning capability is especially important for mining operations and other high-risk environments where rapid response can limit damage and improve safety.

Following detection, the system schedules the collection of high-resolution 3 metre, 8-band Planet satellite imagery for the next seven days. This imagery is used to track the spread and intensity of the fire over time, providing a clear visual record of how the event develops.

After the event, the collected imagery is analysed to produce post-fire damage assessments and burn scar analyses. These outputs help quantify the affected area, support reporting and compliance requirements, and inform rehabilitation or recovery planning.

The result is a complete workflow that moves from detection to response and finally to assessment, all within a single, structured monitoring system.

What are some add-on services available for SWIFTMine?2026-03-25T11:21:27+00:00

SWIFTMine offers a range of add-on services that extend core monitoring capabilities to support more detailed analysis, compliance requirements, and operational oversight in mining environments. These add-ons are designed to address the unique challenges of mine sites, including environmental management, infrastructure tracking, and risk monitoring.

Automated fire monitoring can be included to detect and track fire activity across mine properties and surrounding areas. This is particularly useful for operations located in fire-prone regions where early detection supports safety and asset protection. Post-fire burn scar analysis provides a clear assessment of affected areas, helping with reporting, rehabilitation planning, and risk evaluation.

Dwelling count assessments are often used to monitor informal settlement growth or nearby community expansion, especially in areas surrounding mine boundaries. This supports social risk management and compliance with regulatory requirements.

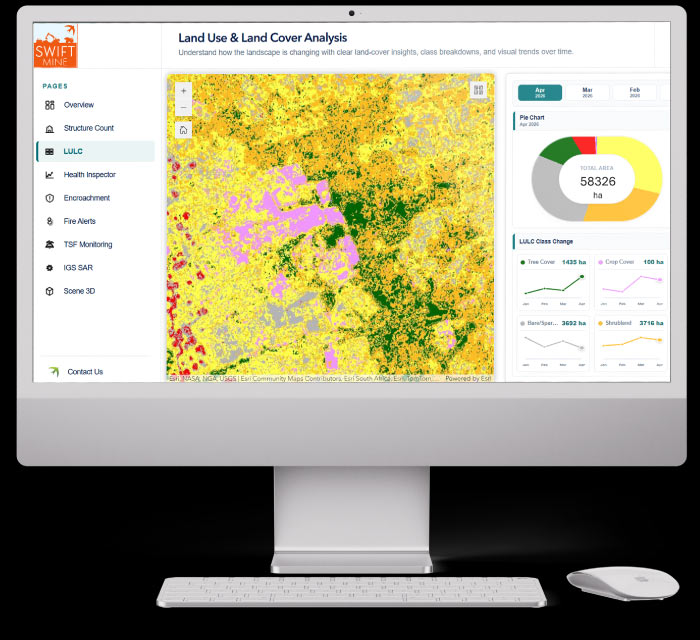
High-resolution base mapping is available for detailed site analysis, offering greater clarity for infrastructure, access routes, and operational zones. Land cover and land use classifications provide structured insight into how land is being used across the site and surrounding areas, supporting environmental monitoring and reporting.

Biodiversity assessments can also be integrated to track ecological conditions and support environmental compliance. In addition, mine site and tailings storage facility digitisation ensures that all key features are accurately mapped and maintained within the platform.

Together, these add-on services allow SWIFTMine to be tailored to specific operational, environmental, and regulatory needs, providing a more complete and reliable view of mining activities.

Go to Top