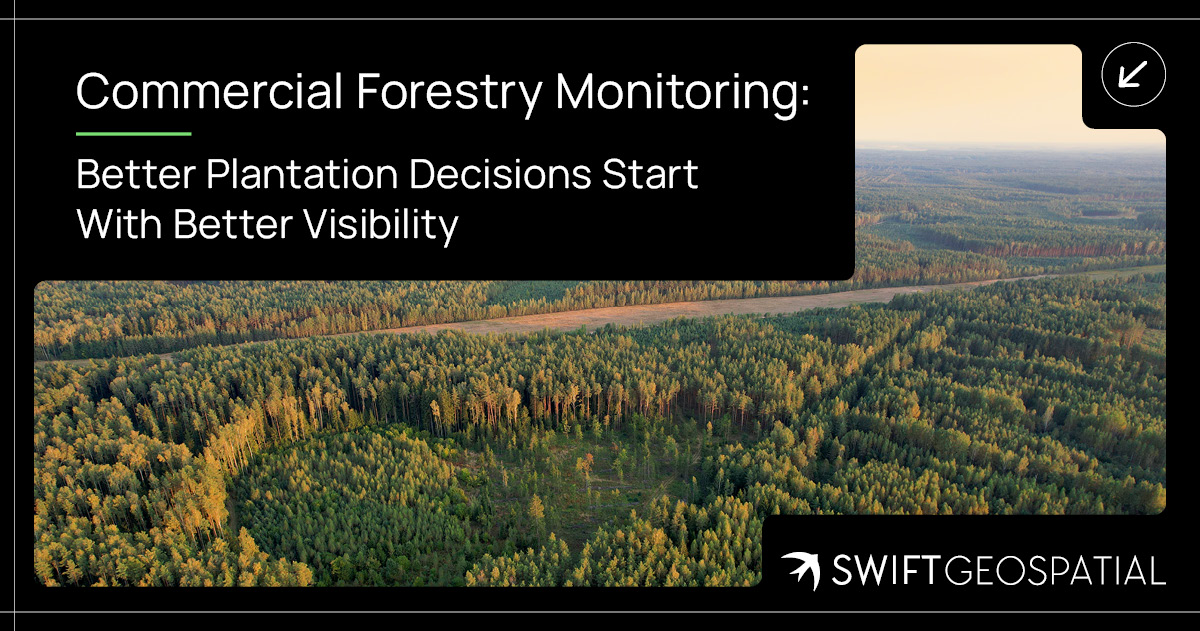
Commercial Forestry Monitoring: Better Plantation Decisions Start With Better Visibility
Healthy commercial plantations depend on regular, reliable information about what is happening across every compartment. SWIFTForest combines recurring satellite imagery, vegetation indices and specialist GIS analysis to support plantation health monitoring across large forestry estates. The platform helps forestry teams identify in-field stress, compare compartment performance, track harvesting activity, assess fire damage and direct field inspections towards areas that may require attention.
Categories:
Date Posted:
October 6, 2026
From Compartment Health to Harvesting: Smarter Commercial Forestry Monitoring With SWIFTForest
Commercial forestry is a long-term business built on living assets. Every compartment, rotation, harvest window, access route, stress signal, fire scar, and growth trend has a direct effect on productivity, planning, risk, and profitability. It is a landscape business, yes, but it is also a timing business. See a problem early, and you can act. See it too late, and the cost has already started growing roots.
That is where SWIFTForest’s Commercial Forestry Monitoring platform comes in.
SWIFTForest turns satellite imagery and specialist GIS analysis into practical forestry intelligence. It helps forestry teams monitor compartment health, identify in-field stress, track harvesting activity, and manage plantation risk through one secure, interactive dashboard. Instead of relying only on delayed site visits, spreadsheets, or second-hand reporting, forestry businesses can work from a clearer and more current view of what is happening across their plantations.
And that matters, because forests do not wait for monthly meetings.
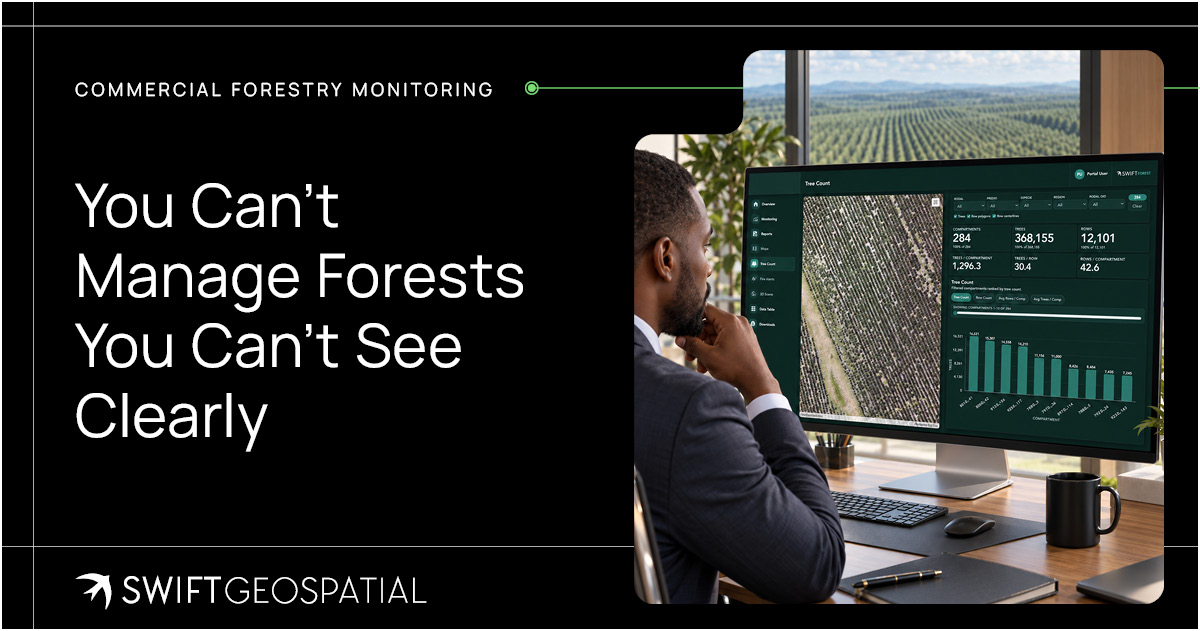
You Can’t Manage Forests You Can’t See Clearly
Forestry teams already know their land. They know the compartments that usually perform well, the areas that tend to struggle in dry seasons, the roads that become difficult after rain, and the plantations that need more eyes on them. That local knowledge is valuable. It should never be tossed aside for a shiny dashboard.
But even the best local knowledge has limits.
Commercial plantations often cover large areas, spread across multiple farms, districts, or even countries. Field teams cannot inspect every hectare every week. Managers cannot make strong decisions from outdated reports. Executives cannot assess risk properly if their view of the estate is fragmented across paper maps, Excel files, WhatsApp photos, and verbal updates.
SWIFTForest helps close that gap.
By using Planet 3 metre, 8-band satellite imagery, the platform monitors commercial forestry areas at a frequency that suits the client’s operational needs and budget. Monitoring can be weekly, biweekly, or monthly. Each new imagery cycle adds to a growing spatial record, helping forestry teams identify trends, spot risk compartments, and understand how conditions are changing over time.
It is not about replacing field teams. It is about helping them know where to go first.
What Is Commercial Forestry Monitoring?
Commercial Forestry Monitoring is the use of satellite imagery, remote sensing, GIS analytics, and forestry dashboards to monitor plantation performance and operational activity across managed forestry estates.
This means bringing together compartment boundaries, vegetation health indicators, in-field stress analysis, harvesting detection, historical imagery, and reporting tools in one platform. Users can view current imagery, compare changes over time, analyse compartment performance, and generate reports that support management, planning, audits, and operational follow-ups.
The platform is built for the real forestry chain, from strategic oversight to field-level work. Executives and asset owners can use it for portfolio-wide visibility, risk awareness, and reporting. Forestry managers and planners can use it to assess compartment health, monitor stress indicators, and track harvesting progress. Operational and field teams can use it to guide inspections, support planning, and follow up on areas of concern.
SWIFTForest helps everyone work from the same map. That shared view is more powerful than it sounds. When teams see the same data, they can argue less about what is happening and focus more on what needs to happen next.

Compartment Health: The Pulse Check of a Plantation
A commercial forestry estate is only as strong as the compartments that make it up. Some compartments are thriving. Some are slowing down. Some may be affected by water stress, pest pressure, disease, poor survival, soil issues, fire damage, or operational disturbance. The tricky part is spotting those signals early enough to do something useful.
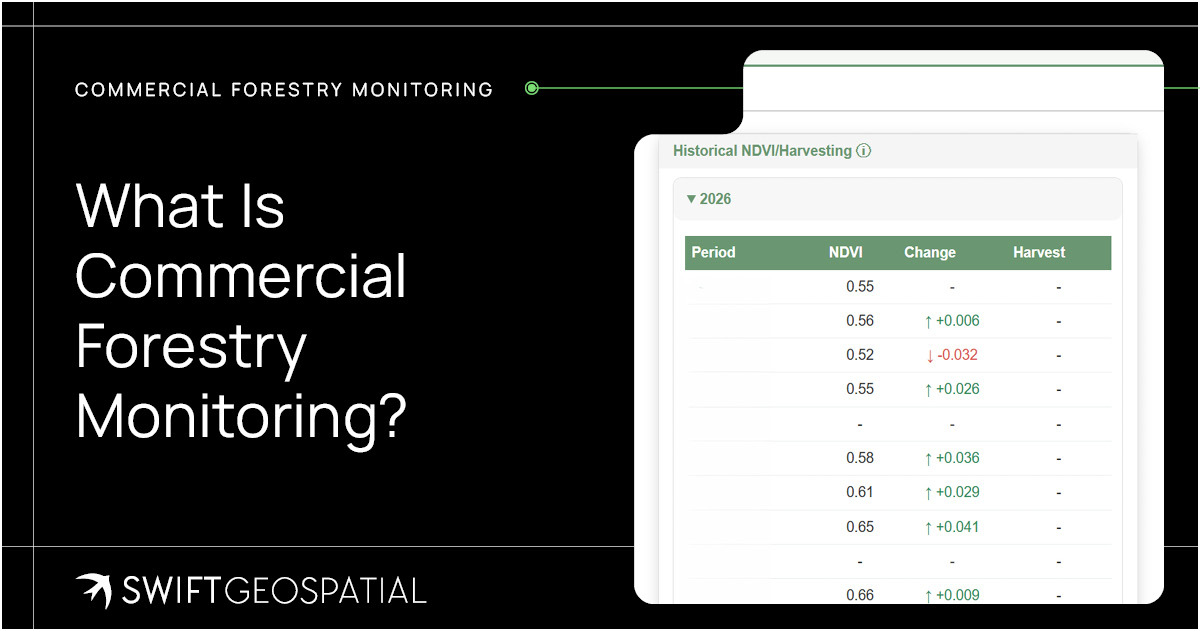
SWIFTForest uses vegetation indices such as NDVI to estimate compartment health and show how individual compartments are performing over time. NDVI, short for Normalised Difference Vegetation Index, is a remote sensing measure used to assess vegetation condition. It helps indicate how green, active, or stressed vegetation may be.
Now, NDVI is not magic. It does not walk through the plantation with a clipboard and a cup of coffee. But it does give forestry teams a consistent, spatial way to compare vegetation condition across large areas. That makes it much easier to identify compartments that may require closer review.
Over time, this becomes even more valuable. A single image can show a moment. A series of images can show a pattern. Patterns are where forestry intelligence starts to get interesting.
With SWIFTForest, managers can visualise compartment trends, compare performance, and use the data to prioritise inspections, support silviculture decisions, and reduce the risk of unnoticed compartment decline.


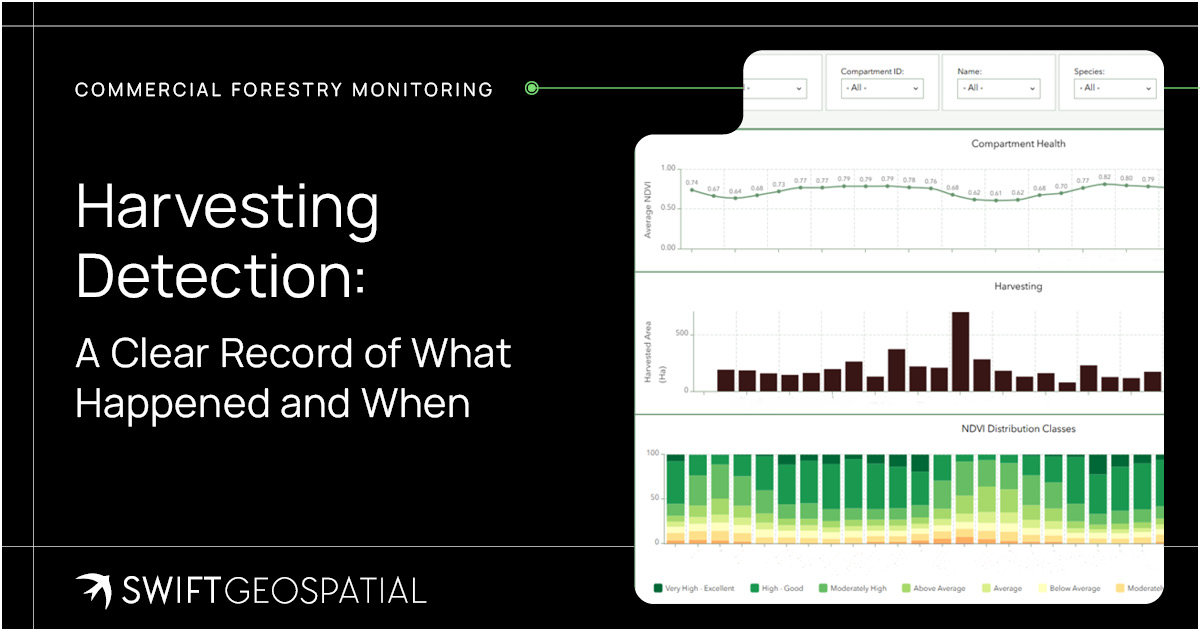
Harvesting Detection: A Clear Record of What Happened and When
Harvesting is one of the most important operational activities in commercial forestry. It affects cash flow, planning, stock records, contractor management, compliance, replanting schedules, and long-term estate performance. When harvesting records are inaccurate or delayed, the knock-on effects can be messy.
SWIFTForest supports harvesting detection by identifying and logging harvesting events across monitored compartments. This allows forestry teams to build a spatial record of harvested areas, estimated hectares harvested, harvest timing, and potential activity that may need review.
That record can support operational oversight in several ways.
Managers can track harvesting progress against planned schedules. Executives can review estate-level activity with more confidence. Planners can use harvested area records to support re-establishment workflows. Compliance teams can maintain a clearer audit trail. In some cases, harvesting detection may also help flag possible illegal logging events or unexpected activity.
A harvesting record should not live only in someone’s notebook or a contractor’s update. It should be mapped, dated, stored, and available when needed.
Why Historical Plantation Data Matters
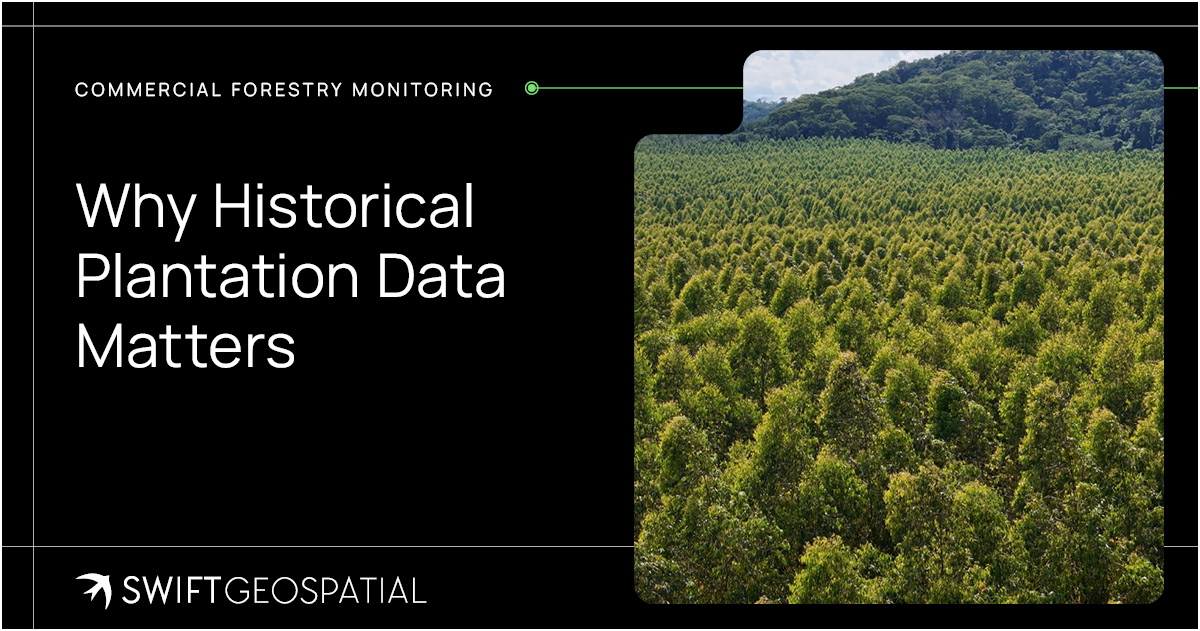
Commercial forestry is not managed in snapshots. It is managed across seasons, rotations, and long investment cycles. That means historical data is not just useful. It is part of the asset story.
SWIFTForest is designed to store historical plantation data alongside live spatial information. Existing compartment records can be linked to current spatial layers, while new satellite imagery and analytical outputs are added with each monitoring cycle. Over time, this creates a growing archive of plantation performance and operational change.
For long-term clients, that archive becomes increasingly valuable. It can support trend analysis, stress cycle review, harvesting history, growth pattern interpretation, audit preparation, and management reporting. It also gives decision-makers a more reliable evidence base when assessing whether a compartment is improving, declining, or responding to intervention.
This is where the platform shifts from being a monitoring tool to becoming a forestry memory bank. A good forestry team remembers. A good platform helps prove what happened.

The Platform Workflow: Simple, Structured, Repeatable
One of the strengths of SWIFTForest is that it follows a practical workflow. It does not ask forestry companies to abandon their entire management process and start again. It gives teams a structured way to bring satellite monitoring into the systems and decisions they already use.
The process starts with registering on SWIFTForest and uploading the areas of interest, also known as AOIs. These may include plantation estates, compartments, farms, grouped management areas, or any other defined forestry zones that need monitoring. From there, the desired monitoring frequency is determined, usually weekly, biweekly, or monthly, depending on the level of oversight required.
The system then collects Planet 3 metre, 8-band imagery over the selected areas. This imagery is used to run commercial forestry health analysis, in-field stress detection, and harvesting analysis across the selected AOIs. The dashboard updates automatically with the latest imagery and analytics, giving users current information through a secure, ready-to-use platform.
That repeatable cycle is important. Forestry teams do not need a once-off pretty map. They need a living monitoring system that updates as conditions change.
Satellite Imagery Chosen for the Forestry Question
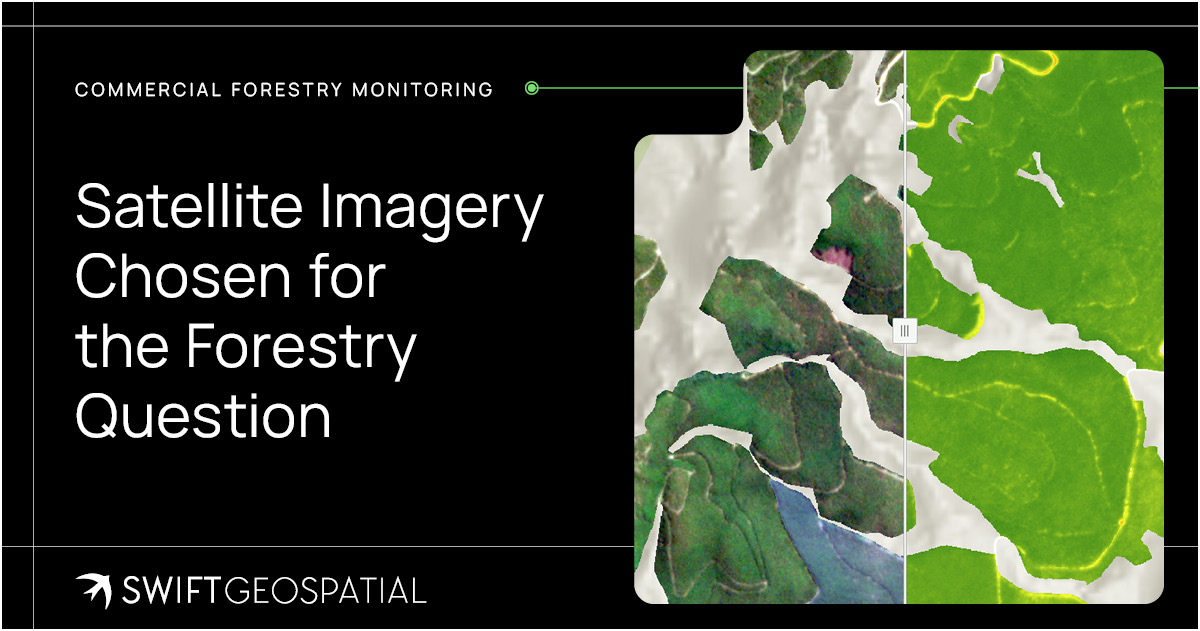
The quality of commercial forestry monitoring depends on more than selecting the image with the highest resolution. Forestry teams also need to consider how often imagery is available, which spectral bands are captured, how large an area must be monitored, and what the analysis needs to reveal. SWIFTForest can use PlanetScope’s daily, 3-metre, 8-band multispectral imagery for frequent monitoring across large plantation estates. This makes it well suited to tracking vegetation health, detecting in-field stress, comparing compartment performance, and identifying harvesting activity over time.
When a specific compartment, harvest boundary, access route, fire-affected area, or suspected disturbance needs closer inspection, higher-resolution imagery can provide more visual detail. Planet SkySat offers archived imagery and new tasking at 30-centimetre or 50-centimetre resolution across four bands. Vantor’s Legion Series and WorldView imagery provides 15-centimetre HD, 30-centimetre, and 50-centimetre options, with configurations ranging from four to sixteen bands and stereo tasking where suitable. Vantor digital terrain models and digital surface models, available at 50 centimetres, 1 metre, 2 metres, and 4 metres, can add useful elevation and surface context for terrain assessment, drainage review, access planning, fire analysis, and other specialised forestry work.
Swift Geospatial’s GIS specialists assess the plantation area, monitoring frequency, analytical goal, required detail, and available budget before recommending an imagery source or combination of sources. Frequent medium-resolution coverage can provide the recurring operational view, while high-resolution imagery can be used where closer verification is justified. This approach gives forestry teams technically appropriate imagery without assuming that the most detailed and costly dataset is necessary across every hectare.
Built for Executives, Managers, Planners, and Field Teams
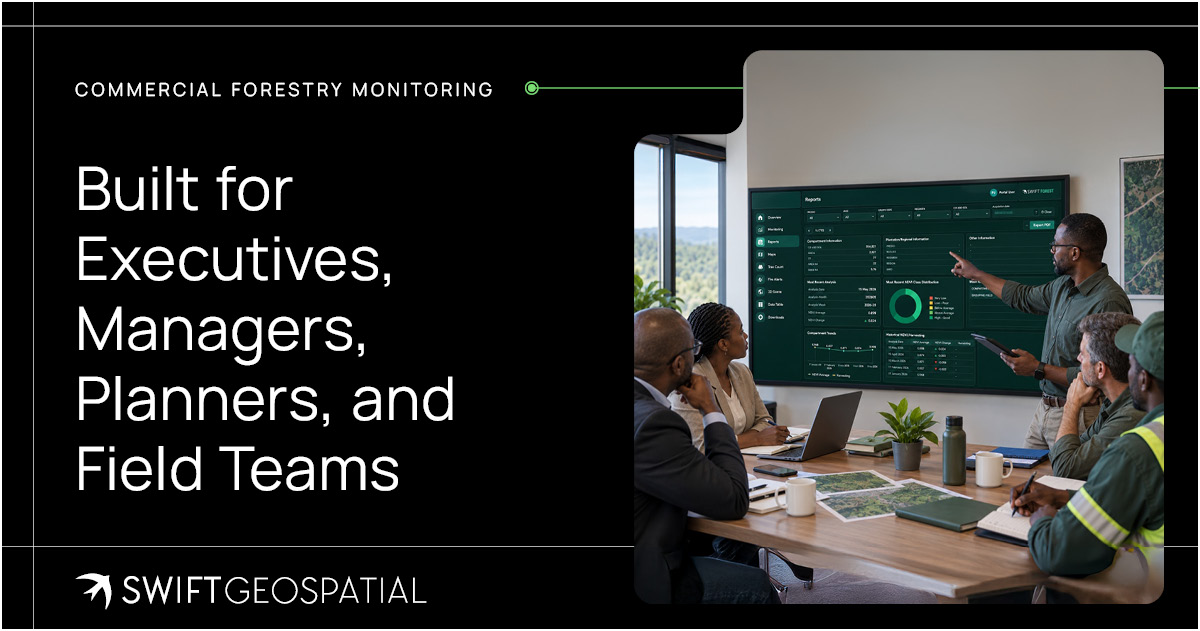
Commercial forestry decisions sit across many roles. An executive may care about portfolio risk, asset performance, reporting, and investment confidence. A forestry manager may care about compartment health, silviculture actions, contractor activity, and harvesting progress. A planner may care about rotations, records, and operational scheduling. A field team may need clear visual context before heading into the plantation and SWIFTForest is built to support all of them.
For executives and asset owners, the platform offers portfolio-wide visibility and stronger reporting. Instead of relying on scattered updates from different regions, decision-makers can view plantation conditions through a shared spatial dashboard. That makes risk easier to discuss and performance easier to understand.
For forestry managers and planners, the platform provides compartment health, stress indicators, and harvesting data in one environment. That helps with prioritisation, planning, and operational review.
For operational and field teams, SWIFTForest provides map-based visual context. Teams can see where change has occurred, where stress is appearing, and where follow-up inspections may be needed. That kind of clarity can save time, fuel, and frustration.
It turns the platform into a common operational picture. Less fog. More forest.
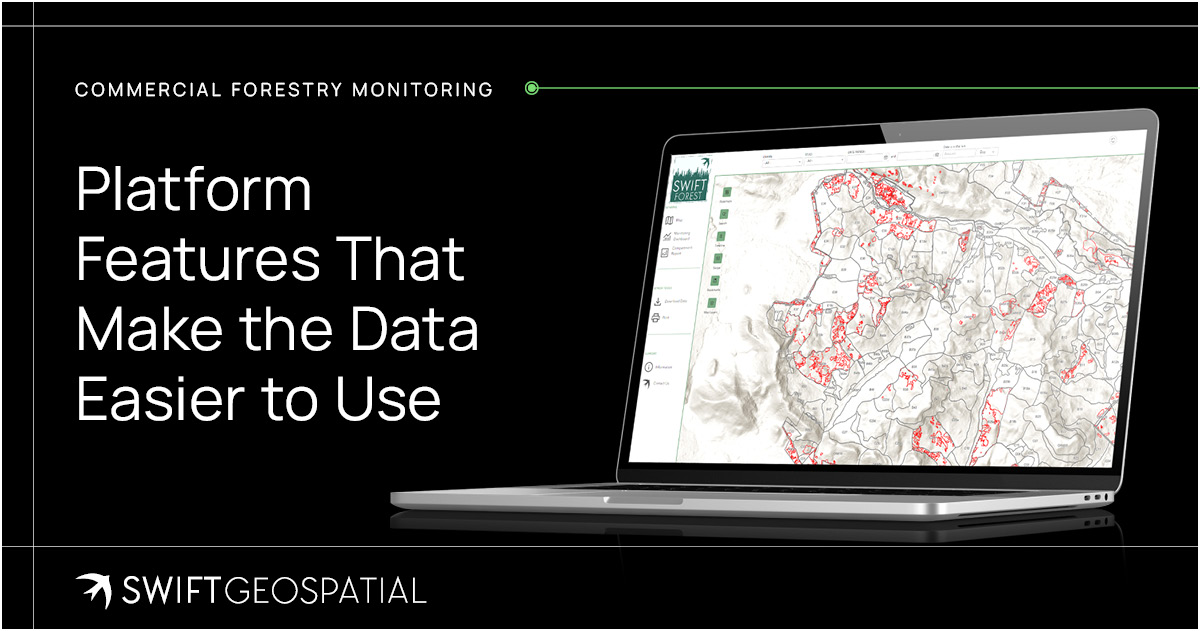
Platform Features That Make the Data Easier to Use
A monitoring platform is only useful if people can actually use it. SWIFTForest has been designed to be live, interactive, secure, and practical for forestry teams with different levels of technical experience.
The Map page allows users to view RGB imagery, NDVI imagery, and false colour imagery. It includes tools such as time sliders, filters, and dual map modes, which are useful for comparing compartments and viewing changes across different dates.
The Compartment Mapping page allows users to toggle layers on and off, including RGB imagery, compartment outlines, NDVI layers, and harvesting layers. This helps users understand each compartment’s unique health and harvesting information without drowning in unnecessary clutter.
The Monitoring page brings imagery and analytics together. Users can select individual compartments, grouped compartments, or all compartments to view the latest health and harvesting data.
The Report page allows users to generate reports based on selected areas. Reports can focus on specific compartments or broader plantation areas, depending on what the user selects at the time of printing. The layout can also be customised, which is useful when reporting needs differ between management, operations, compliance, and clients.
The platform also supports secure login access, intuitive colours, legends and labelling, fast load times, and REST API compatibility. That means it can be linked or integrated into existing systems when needed. Practical details like this matter. A platform that looks clever but slows everyone down will not last long in the forestry world.

Add-On Services for Deeper Forestry Insight
Standard monitoring gives forestry teams a strong view of compartment health, in-field stress, and harvesting detection. But some projects need more detail. That is why SWIFTForest also offers add-on services that can be tailored to each forestry operation.
These include in-field surveys, EUDR risk analysis, tree count and height analysis, volume calculations, above-ground biomass assessments, biodiversity assessments, compartment digitisation, high-resolution base mapping, post-fire and burn scar analysis, and ultra-high-resolution satellite imagery tasking. Each add-on serves a different purpose.
Tree height and count data may support operational planning, although mature plantations with closed canopies can make tree counting difficult. Volume calculations generally require field data or LiDAR because standard 2D satellite monitoring imagery cannot accurately measure vertical structure on its own. Post-fire burn scar analysis can help quantify damage, support replanting decisions, and provide evidence for reporting or insurance. Compartment digitisation can turn legacy boundaries and paper-based records into usable spatial data.
The point is flexibility. No two forests are the same, and no two forestry businesses need exactly the same data. SWIFTForest can be shaped around the questions that matter most to each client.

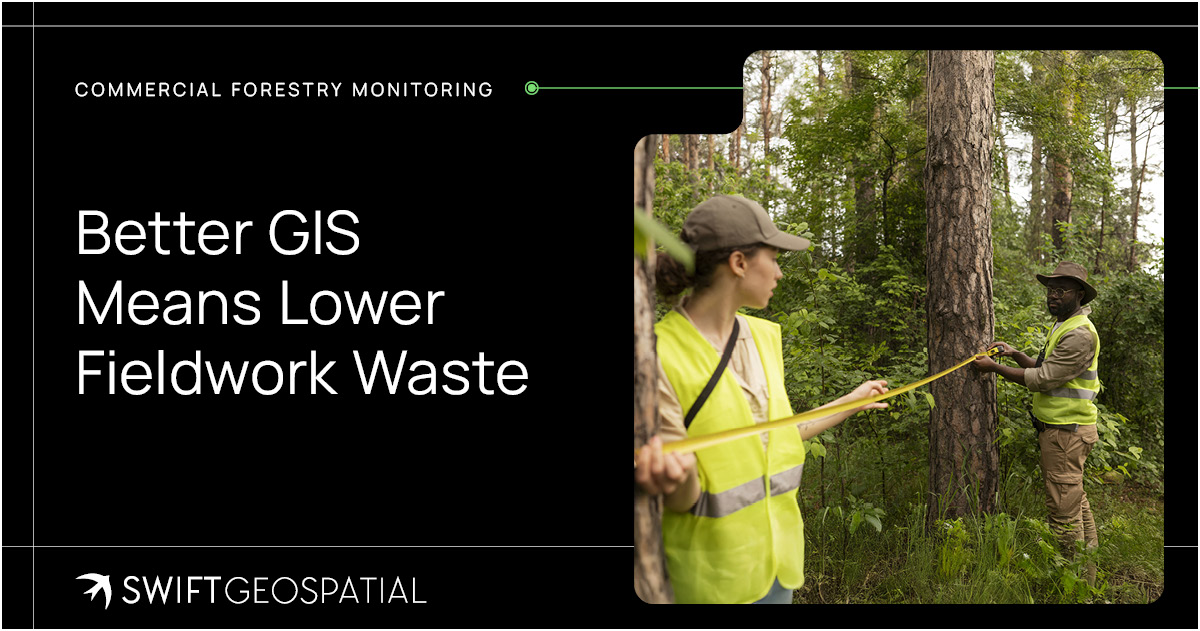
Better GIS Means Lower Fieldwork Waste
Fieldwork will always be part of commercial forestry. A satellite image cannot replace the smell of smoke after a fire, the crunch of dry leaf litter underfoot, or the experienced eye of a forester standing inside a compartment. Some things still need to be checked in person.
But GIS can reduce unnecessary fieldwork.
By using satellite imagery and spatial data, SWIFTForest allows forestry teams to monitor large areas remotely and identify where conditions have changed. Swift Geospatial’s GIS specialists compare imagery across dates, analyse vegetation indices, connect findings to compartment boundaries, map harvesting events, and place potential stress or disturbance within its wider plantation context. This interpretation is what turns imagery into usable forestry intelligence. Instead of sending teams to inspect every compartment on a routine cycle, managers can use the platform to highlight where field visits are actually needed.
This can reduce travel time, fuel costs, labour pressure, and inspection fatigue. It also means skilled staff can focus their attention on the areas most likely to need action. That is not just efficient. It is sensible.

Pricing That Reflects the Forest, Not a Generic Package
Commercial forests vary widely in size, structure, management needs, geography, species, risk profile, reporting requirements, and monitoring frequency. Because of that, SWIFTForest pricing is tailored rather than fixed.
Costs are typically made up of the platform cost, storage and hosting fees, a setup fee for new clients, and optional support hours. Platform costs are charged at a fixed rate per hectare, while quotations are prepared according to each client’s specific requirements.
This approach makes sense because forestry monitoring should not be squeezed into a one-size-fits-all package. A smaller plantation with monthly monitoring does not need the same setup as a large forestry portfolio requiring frequent analytics, reporting, integration, and add-on services. The forest shapes the solution.

Why Commercial Forestry Monitoring Matters Now
Forestry is facing pressure from every direction. Climate volatility is increasing operational uncertainty. Fire seasons are harder to manage. Supply chains are being watched more closely. Investors want better visibility. Regulators want evidence. Customers want responsible sourcing. Managers want fewer surprises.
And underneath all of that, forestry businesses still need to grow trees, protect assets, manage costs, harvest efficiently, and plan for the future.
SWIFTForest helps bring those priorities into one clearer view.
By combining satellite imagery, compartment health analysis, in-field stress detection, harvesting detection, reporting tools, and GIS dashboards, the platform gives forestry teams a practical way to monitor plantations and act sooner. It supports better planning, stronger oversight, smarter fieldwork, and clearer reporting.
Commercial forestry will always involve uncertainty. Weather changes. Markets shift. Pests arrive uninvited. Fire does what fire does. But better visibility gives teams a stronger position from which to respond. And in forestry, that stronger position can protect years of investment.

Ready to Monitor Your Plantations With More Confidence?
SWIFTForest’s Commercial Forestry Monitoring platform helps forestry companies, asset owners, managers, planners, and operational teams monitor compartment health, identify in-field stress, track harvesting activity, store historical data, and generate practical reports from one secure dashboard.
Whether the goal is better operational oversight, reduced fieldwork waste, improved harvesting records, fire impact assessment, risk management, or long-term plantation performance, SWIFTForest gives commercial forestry teams the visibility they need to make better decisions.
To learn more about Commercial Forestry Monitoring or request a tailored quotation for your forestry areas, contact Swift Geospatial and book a consultation.
Article FAQ
Swift Geospatial’s GIS specialists compare imagery across dates, analyse vegetation indices and connect findings to plantation and compartment boundaries. They can map stress patterns, harvesting events, fire-affected areas and historical changes. This turns satellite imagery into practical forestry intelligence that supports targeted inspections, operational planning, reporting and better management decisions.
SWIFTForest can use PlanetScope’s daily 3-metre, 8-band multispectral imagery for recurring plantation health monitoring across large areas. Planet SkySat and Vantor imagery can provide higher-resolution options when selected compartments, harvesting events, fire damage or other concerns require closer visual verification.
Satellite imagery can reveal patterns associated with vegetation stress, poor establishment, canopy decline, fire damage, harvesting activity and other changes within commercial plantations. These patterns may be connected to drought, pests, disease, nutrient deficiencies, waterlogging or operational disturbance. Satellite findings guide investigation, but field verification may still be needed to confirm the cause.
SWIFTForest analyses satellite imagery captured over defined plantations and forestry compartments. Vegetation indices such as NDVI help indicate differences in vegetation condition, while recurring imagery allows GIS specialists to compare changes across dates. The resulting maps, analytical layers and reports help managers identify compartments that may require closer investigation.
Plantation health monitoring is the recurring assessment of vegetation condition, in-field stress and operational change across commercial forestry estates. SWIFTForest uses satellite imagery, remote sensing and GIS analysis to help forestry teams compare compartment performance, detect areas of concern and track plantation conditions over time.