GIS Agricultural Monitoring for Smarter Farm Decisions
SWIFTFarm combines recurring satellite imagery with GIS analysis to help agricultural teams monitor field conditions, identify changes and direct resources where they are needed as climate-related disruption makes farm management decisions more demanding.
Categories:
Date Posted:
November 3, 2026
Smarter Agricultural Monitoring With SWIFTFarm
Farms have always operated within changing natural systems, but the growing frequency and severity of climate-related disruption are making agricultural decisions more difficult and more consequential. By combining recurring satellite imagery with GIS analysis, SWIFTFarm gives agricultural teams a regularly updated view of field condition and change, helping them direct attention and resources where they are most needed.
Farming under greater uncertainty
Agriculture has always depended on variables that can’t be fully controlled. Rainfall, temperature, soil condition, pests and disease all influence how a crop develops. But what’s changed dramatically in the last several years is the scale of the uncertainty surrounding many of those variables, and the financial pressure under which farmers and agricultural businesses must operate.
The World Meteorological Organization’s State of the Climate in Africa 2025 reports that the continent is warming faster than the global average. Floods accounted for more than half of the extreme-weather events reported across Africa in 2025, while drought affected more than 8.5 million people in East Africa. Rainfall trends also vary sharply between regions: some areas are experiencing heavier precipitation and flooding, while others face declining rainfall, persistent drought or growing aridity.
For agricultural operations, this variability affects far more than the planting calendar. It influences water availability, crop stress, pest and disease pressure, fire exposure, harvesting conditions, labour planning and the cost of every input applied to the land. A decision made too late, or applied uniformly across a field with very different conditions, can carry consequences for both yield and profitability.
The response cannot be to remove uncertainty altogether. No monitoring system can make weather predictable or shield crops from every extreme event. The practical opportunity lies in improving how quickly agricultural teams can see change, understand where it is occurring and decide what deserves closer attention.
When change is uneven, farm-wide averages tell only part of the story
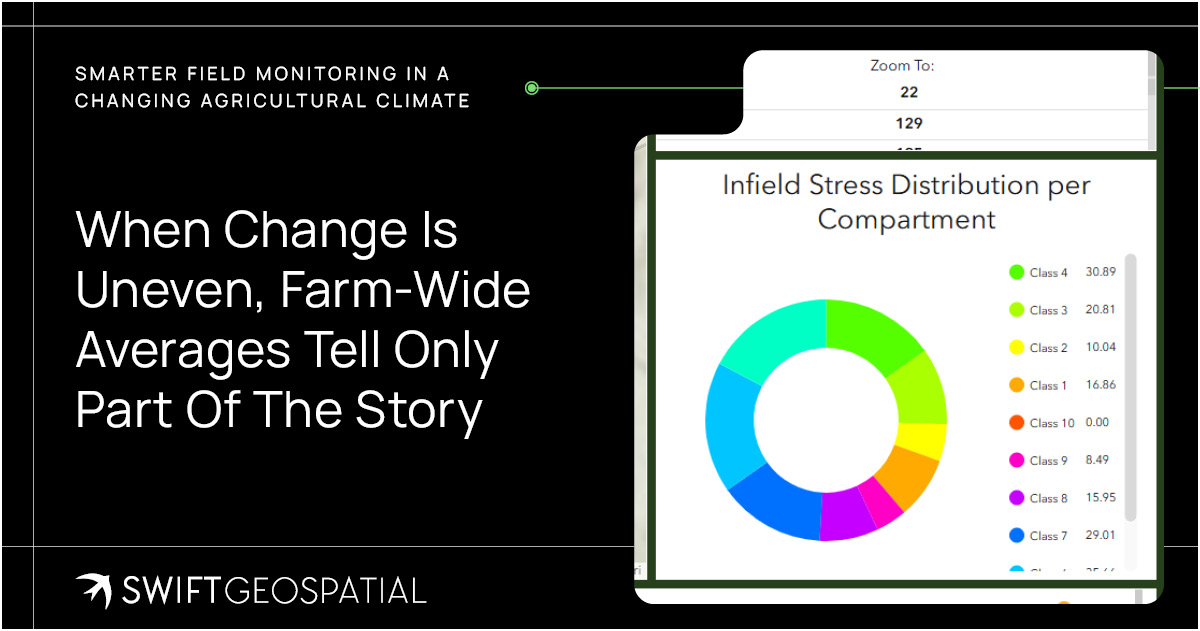
A farm may be managed as one operation, but it rarely behaves as one uniform landscape. Soil type, slope, drainage, irrigation coverage, planting date, crop variety and previous land use can all influence how separate fields – or different zones within the same field – respond to identical weather conditions.
This matters because an average can conceal the very conditions that require action. A farm-wide rainfall figure does not show where water is accumulating or where vegetation may still be under stress. A scheduled inspection can confirm conditions along its route, but it cannot give field teams the same level of visibility across every boundary, crop block and remote area at once.
Farm managers often need to answer more specific questions:
- Which fields are developing as expected?
- Where has crop condition changed since the previous assessment?
- Is an area of stress isolated or spreading?
- Does observed harvesting activity match the operational plan?
- Which locations justify an immediate field inspection, and which can continue to be monitored?
Answering those questions consistently requires information that is both spatial and time-based: evidence that shows not only what conditions look like now, but how they differ across the land and how they have changed.
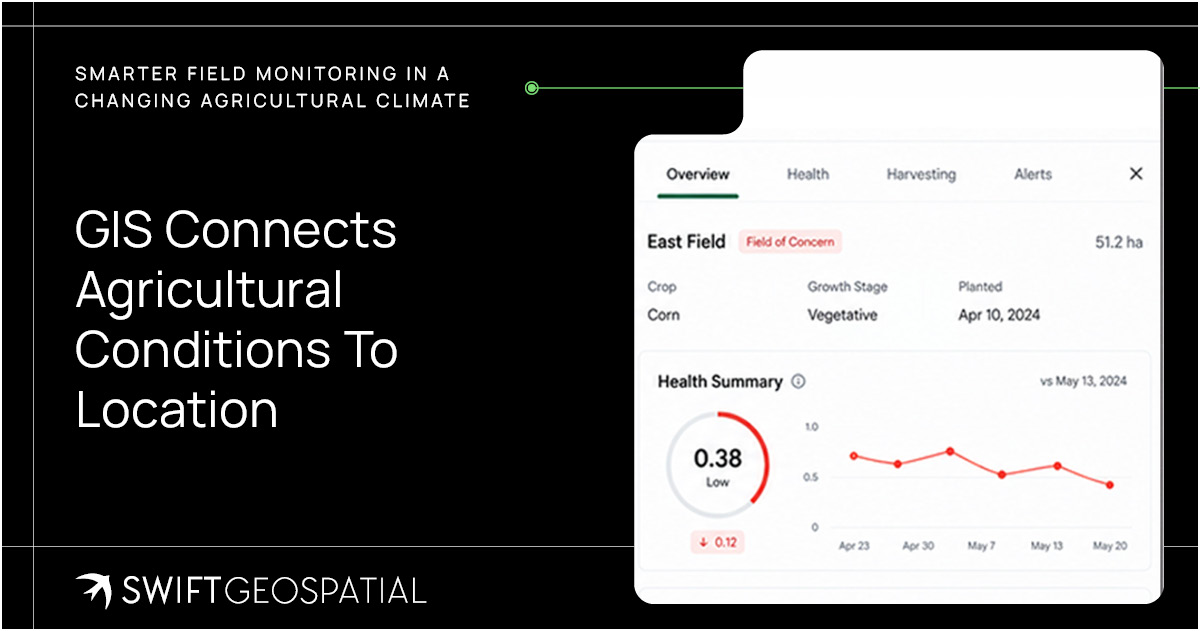
GIS connects agricultural conditions to location
In agriculture, Geographic Information Systems can bring together farm and field boundaries, satellite imagery, crop information, terrain, weather data, soil observations and historical records within a shared spatial environment. A 2024 review of GIS-driven agriculture describes how these layers can be used to examine variation in crop health, soil properties, weather patterns and topography, supporting more targeted farm-management decisions.
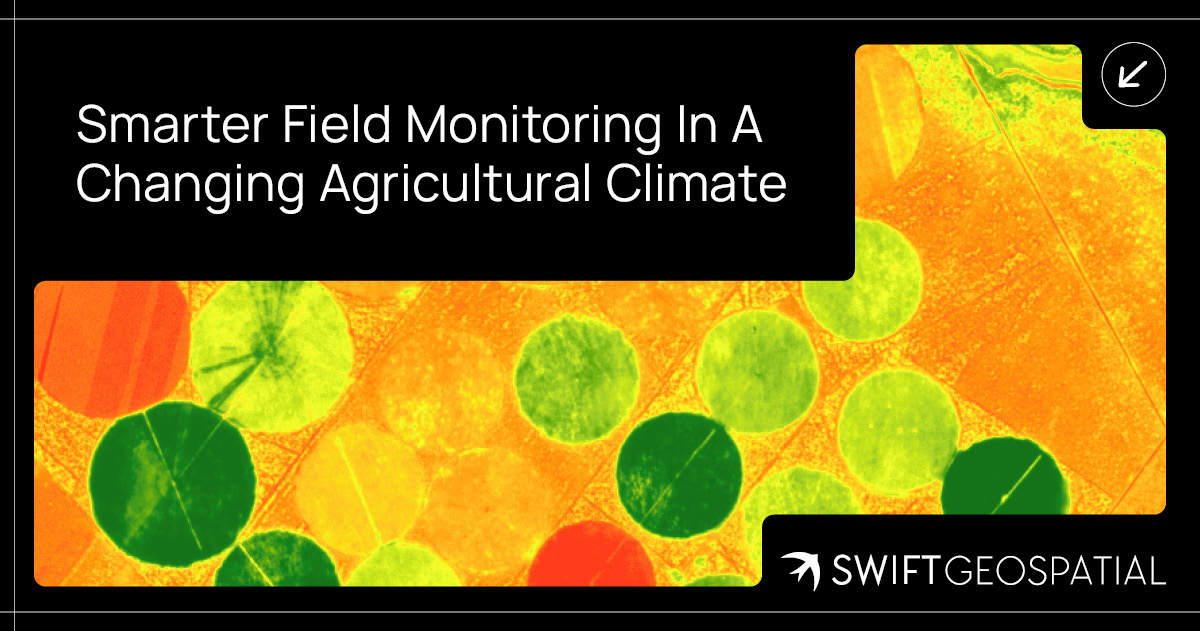
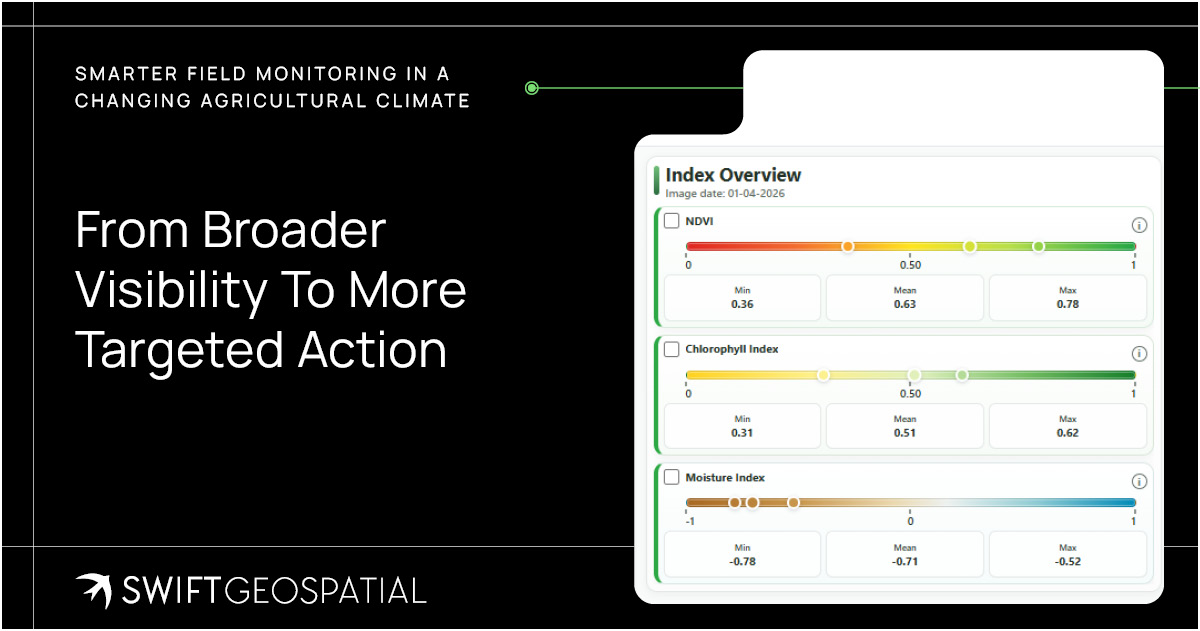
Satellite imagery extends this view across broad areas. Multispectral sensors capture information beyond the colours visible to the human eye, allowing vegetation indices and other analytical methods to indicate differences in crop vigour or possible stress. Imagery collected at recurring intervals can then be compared to show how field conditions are developing through the season.
These observations don’t automatically explain the cause of every change. A weaker vegetation signal could relate to water stress, nutrient availability, pests, disease, soil variability or another local condition. Agricultural knowledge and field verification remain essential. The value of GIS is that it helps teams locate the anomaly, understand its extent and place it within a wider operational and environmental context before deciding how to respond.
Introducing SWIFTFarm
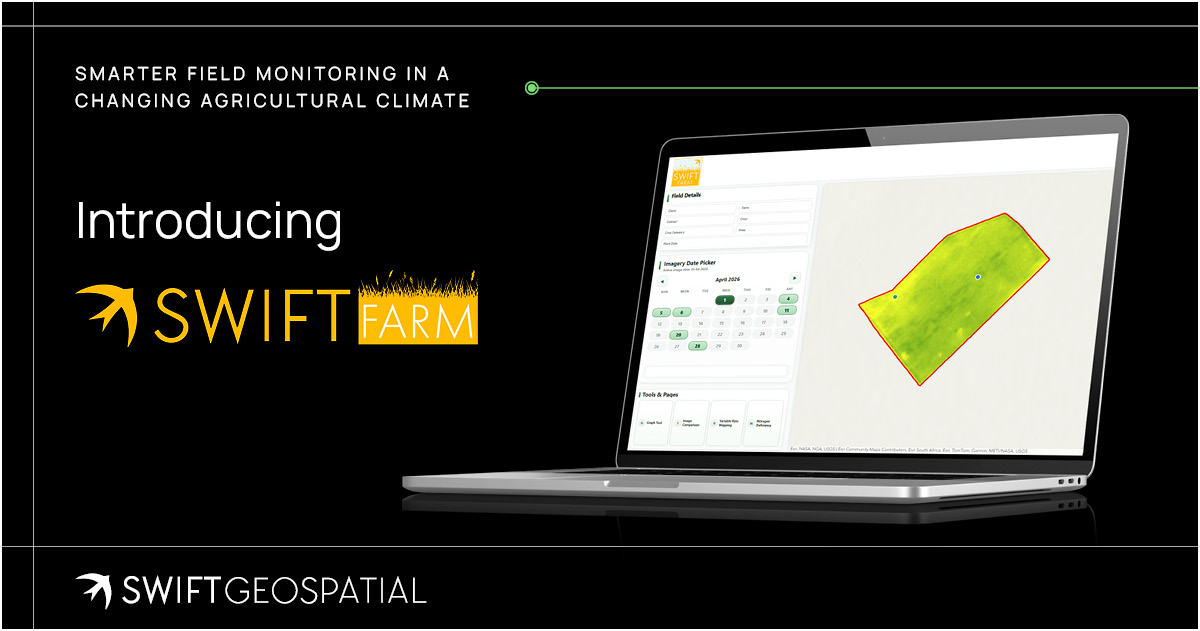
SWIFTFarm is Swift Geospatial’s online agricultural monitoring platform. It combines recurring satellite imagery, GIS analysis and field-level analytics within one dashboard, giving farm managers and agricultural teams a regularly updated view of crop condition and operational change.
The standard SWIFTFarm product includes:
- Recurring satellite imagery collected according to an agreed monitoring cycle.
- Field-health information showing differences in vegetation conditions across monitored areas.
- In-field stress indicators that highlight zones requiring further review or investigation.
- Harvesting-detection data that creates a spatial record of activity across fields.
- An online dashboard through which imagery, field information and analytical outputs can be reviewed together.
SWIFTFarm uses PlanetScope imagery for recurring vegetation analysis and field monitoring, with higher-resolution imagery available where more detailed assessment is required. Additional services can include automated fire monitoring, crop-biomass analysis, field digitisation, in-field surveys and high-resolution base mapping.
The combination matters because each component contributes something different.
- Satellite imagery provides repeatable coverage.
- GIS places observations within farm boundaries and operational context.
- Analysis helps identify variation and change.
- The dashboard brings the resulting information into a format that can be reviewed by the people responsible for field operations, agronomy, planning and management.
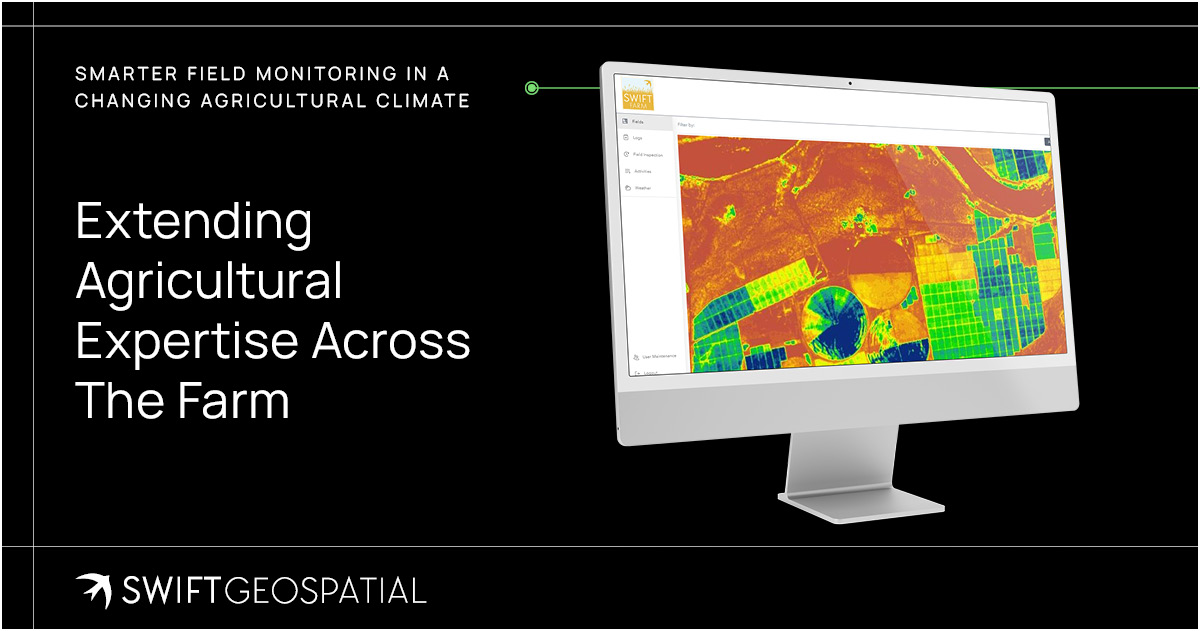
Extending agricultural expertise across the farm
SWIFTFarm is not intended to replace the farmer, agronomist or field team. Satellite imagery cannot inspect a plant at close range, test the soil or determine the cause of every anomaly on its own. What it can do is extend the reach of agricultural expertise by showing where conditions differ and where closer attention may be justified.
This can make fieldwork more purposeful. Instead of relying only on fixed inspection routes or waiting until stress becomes widely visible, teams can use the latest spatial information to prioritise areas for investigation. Managers can review the same field record across locations, while historical imagery provides context for understanding whether an observed condition is new, recurring or part of an expected seasonal pattern.
Over time, the platform becomes a living spatial record of the farm: one that can support seasonal comparison, operational reporting and the continuing assessment of how crops and fields respond to changing conditions.
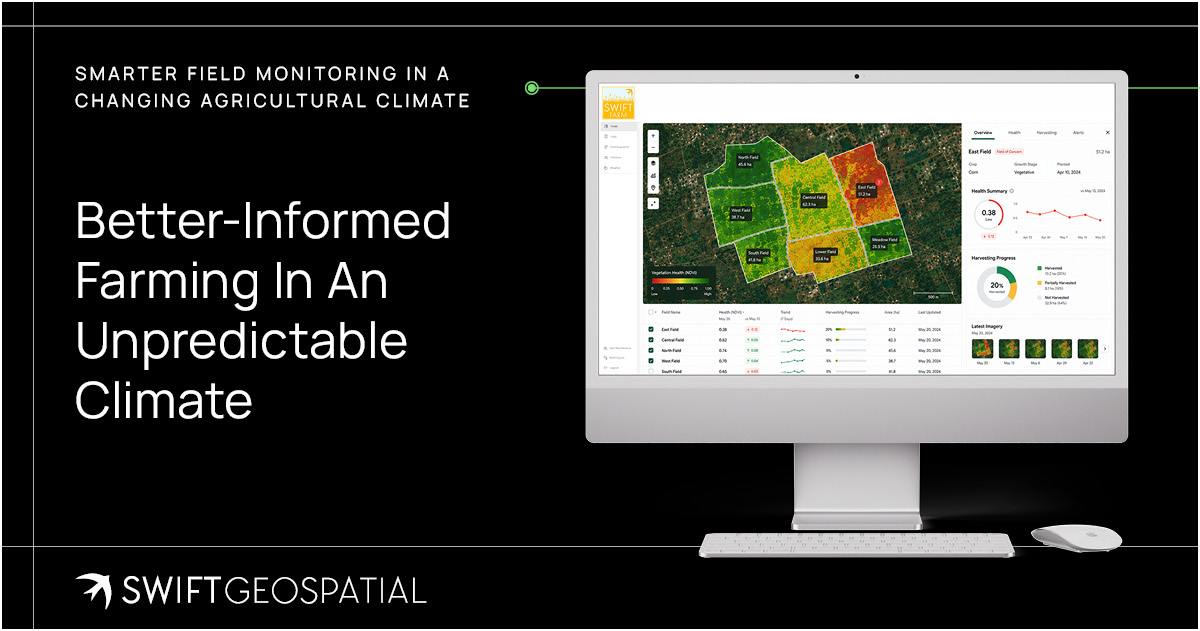
Better-informed farming in an unpredictable climate
Agricultural resilience is not created through one decision made before planting. It depends on the continuing ability to observe, interpret and respond as conditions change. Climate variability, water pressure and rising input costs make that process more demanding, particularly across large or geographically dispersed operations.
Greater visibility cannot eliminate these pressures, but it can give agricultural teams a stronger starting point. By bringing recurring satellite observations, field boundaries and GIS analysis into one monitoring environment, SWIFTFarm helps organisations build a more consistent evidence base for crop monitoring, resource planning and operational response.
To learn more about SWIFTFarm or discuss a monitoring approach for your agricultural operation, contact Swift Geospatial to book a consultation.
Article FAQ
Yes, GIS is suitable for small-scale farms and can be adapted to fit operations of any size. While often associated with large commercial agriculture, GIS can provide real value even on smaller farms by improving visibility and decision making.
For small-scale farmers, GIS helps monitor crop health, identify problem areas, and manage inputs more efficiently without requiring large teams or complex infrastructure. It allows farmers to focus their efforts where it matters most, rather than treating the entire farm uniformly.
Because GIS solutions are scalable, they can start with basic monitoring and gradually expand as needs grow. This means farmers can adopt the technology at their own pace, adding more data, analysis, or features over time.
Ultimately, GIS supports better use of resources, reduces unnecessary costs, and helps small-scale farms operate with the same level of insight typically associated with larger operations.
Yes, GIS can support crop yield prediction when combined with additional data inputs. SWIFTFarm uses spatial analysis alongside historical data, weather patterns, and current crop conditions to estimate potential yields across fields.
Satellite imagery provides insight into crop health and growth patterns over time, while historical datasets help establish baseline performance for specific fields. When this is combined with weather data such as rainfall and temperature trends, it becomes possible to model how crops are likely to perform under current conditions.
That said, accurate yield prediction requires more than remote sensing alone. Ground data remains essential. Collaboration between farmers, field teams, and GIS specialists is needed to collect and validate yield information, ensuring that models are calibrated correctly and reflect real-world conditions.
The result is not a fixed prediction, but a data-informed estimate that improves over time as more information is collected. This supports better planning, resource allocation, and decision making throughout the growing season.
Precision agriculture is a farming approach that uses GIS technology, satellite imagery, and data analysis to manage fields at a more detailed level rather than treating the entire farm as a single unit. Instead of applying inputs uniformly, it focuses on understanding variation within fields and responding accordingly.
Using spatial data, farmers can identify differences in soil conditions, moisture levels, crop health, and growth patterns across their land. This allows water, fertiliser, and pesticides to be applied only where they are needed, rather than across entire fields. The result is more efficient resource use, reduced input costs, and improved crop performance.
Precision agriculture also supports better timing of operations. By monitoring field conditions regularly, farmers can decide when to irrigate, fertilise, or harvest based on actual conditions rather than fixed schedules.
Over time, this data-driven approach builds a clearer understanding of how each field behaves, helping improve planning, reduce waste, and increase overall productivity. It shifts farming from broad estimation to targeted, informed decision making.
SWIFTFarm primarily uses Planet’s 3 metre, 8-band PlanetScope satellite imagery as the foundation for agricultural monitoring. This imagery is collected frequently, allowing farms to be observed consistently across planting, growing, and harvesting cycles.
The 8-band spectral capability supports detailed vegetation analysis by capturing information beyond standard visual imagery. This enables accurate field health assessment, helping identify areas of strong crop performance as well as zones experiencing stress due to water shortages, pests, or soil variability.
PlanetScope imagery also supports harvesting detection by tracking changes in field conditions over time. By comparing imagery across different dates, SWIFTFarm can identify when and where harvesting activity has occurred, providing a clear record of field operations.
For projects that require more detailed analysis, an additional high-resolution satellite image can be incorporated. This is typically used for base mapping, boundary verification, and more focused investigations where finer spatial detail is needed.
The Automated Fire Monitoring system within SWIFTFarm is designed to detect fire events early and track their impact across agricultural land. It starts with continuous monitoring using NASA’s thermal infrared sensors, which identify abnormal heat signatures that may indicate active fires or emerging hotspots.
When a potential fire event is detected, the system automatically sends an alert notification. This allows farmers and land managers to respond quickly, which is critical for protecting crops, infrastructure, and surrounding land.
After detection, SWIFTFarm schedules the collection of high-resolution 3 metre, 8-band Planet satellite imagery for the following seven days. This imagery is used to monitor how the fire spreads, how quickly it moves, and which areas are affected over time.
Once the event has stabilised, the imagery is analysed to produce post-fire damage assessments and burn scar analyses. These outputs help quantify the affected area, support recovery planning, and provide useful data for reporting or insurance claims.
The system provides a complete workflow from early detection to post-event assessment, helping agricultural operations respond faster and recover more effectively.
SWIFTFarm offers a range of add-on services that extend the platform beyond standard monitoring, allowing farmers and agricultural managers to gain deeper insight and more detailed analysis where needed.
Automated fire monitoring can be included to detect and track fire activity across farmland, providing early warning and helping reduce risk to crops and infrastructure. Post-fire damage and burn scar analysis can then be used to assess affected areas, support recovery planning, and provide clear records for reporting or insurance purposes.
Crop biomass analysis is available as an advanced layer of insight, helping estimate crop growth and productivity across fields. This supports yield estimation, performance tracking, and more informed decision making throughout the growing season.
Field digitisation services allow farm boundaries, blocks, or management zones to be accurately mapped and structured within the platform. In-field surveys can be integrated to capture ground-level observations and validate remote sensing data, improving overall data reliability.
For more detailed investigations, high-resolution satellite imagery can be added to provide greater clarity at a field level. This is particularly useful for identifying specific issues, validating conditions, or supporting precision agriculture practices.
Together, these add-on services allow SWIFTFarm to be tailored to specific agricultural needs, whether the focus is productivity, risk management, or detailed field-level analysis.
The standard SWIFTFarm product provides access to the SWIFTFarm platform through an online dashboard designed for agricultural monitoring and analysis. This dashboard acts as a central space where satellite imagery, field data, and analytics are brought together for easy interpretation and use.
Included in the product is recurring satellite imagery collected at regular intervals. This allows farmers and agricultural managers to monitor changes over time, track seasonal patterns, and maintain consistent visibility across all fields.
The platform also delivers field health insights, highlighting areas of strong growth as well as zones that may require attention. In-field stress detection identifies potential issues such as water stress, pest pressure, or soil variability, enabling more targeted interventions and better resource management.
Harvesting detection data is included to track activity across fields, providing a clear record of when and where harvesting occurs. This supports operational planning, reporting, and overall farm management.
Together, these features provide a practical, data-driven view of agricultural operations, helping improve efficiency, reduce input waste, and support better decision making.